What are Stock Fibonacci Retracement Levels?
What Does Stock Fibonacci Retracement Levels Mean?
Stock Fibonacci Retracement Levels indicator is a stocks tool used by many traders to spot stocks price retracements also known as stocks price pullback.
Stock Fibonacci Retracement Levels is a type of line study used in stocks to predict and calculate these stocks price retracement levels.
Stock Fibonacci Retracement Levels indicator is placed directly on the stock chart within the stocks platform provided by your stocks broker, This Stock Fibonacci Retracement Levels indicator will then automatically calculate these retracement stocks price pullback levels on the stock chart.
What are the Stock Fibonacci Retracement Levels? - What is Stock Fibonacci Retracement?
- 23.6% Stock Fibonacci Retracement Areas
- 38.2% Stock Fibonacci Retracement Areas
- 50.0% Stock Fibonacci Retracement Areas
- 61.8% Stock Fibonacci Retracement Areas
38.2% & 50.0% Stock Fibonacci Retracement Areas are most used and most of the time this is where the price retracement will reach. With 38.2% Stock Fibo Retracement Level being the most popular and most widely used retracement level in stocks.
61.8% Stock Fibonacci Retracement Level is also commonly used to set stop losses for trades opened using this stocks retracement strategy.
This Stock Fibonacci Retracement Levels tool is plotted in direction of the market trend as displayed in the two examples below.
Fibonacci Retracement Areas on Upward Stocks Trend
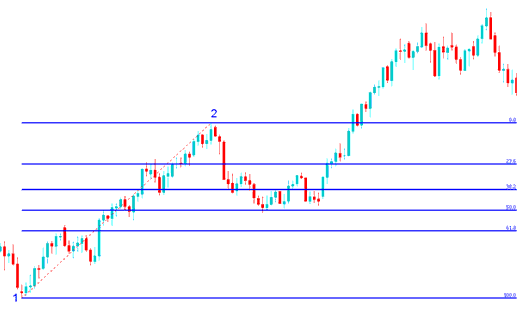
Fibonacci Retracement Areas on Upward Stocks Trend - What are Stock Fib Retracement Areas?
Fibonacci Retracement Areas on Downward Stocks Trend
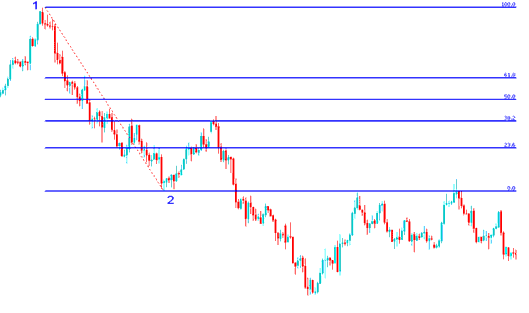
Fibonacci Retracement Areas on Downward Stocks Trend - What are Stock Fib Retracement Areas?


