Trading Stocks Read Head and Shoulders Chart Pattern
A Head & Shoulders pattern is a bearish trend reversal signal that signals the current upwards stocks market trend is about to reverse once the Head & Shoulders stocks trading pattern is confirmed.
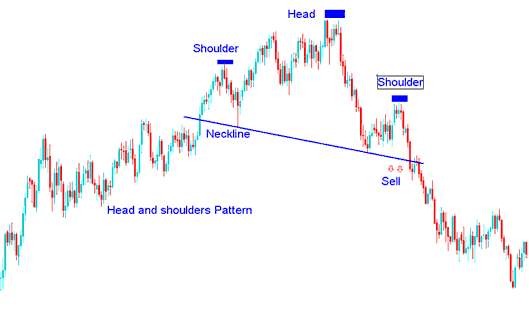
The Head & Shoulders chart pattern is a pattern with three consecutive highs where second high is slightly higher than the first & third high which signals upward trend is losing momentum & if stocks price of the stocks falls below the support zone which is the 2 lows between the three highs then the Head & Shoulders pattern is considered to be confirmed & the stocks price of the stocks changes to a bearish trend.
Read Head and Shoulders Chart Pattern


