Stocks Trading Interpret Bear Pennant Chart Pattern
Trading Stock Read Bear Pennant Trading Pattern
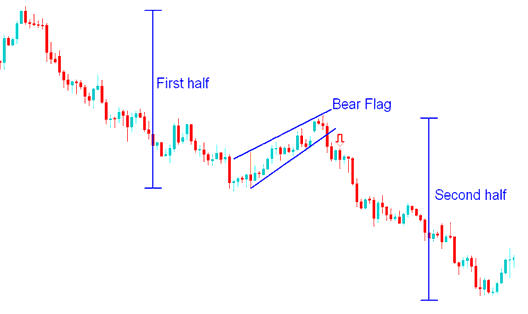
This bear pennant pattern is found in a downward trend. The bear pennant chart pattern is a trend continuation pattern where the price retrace slightly with a narrow price action which has a slight upward tilt. Sell signal is generated when the price penetrates lower line of the inverted bear pennant pattern. The pennant portion of this bear pennant chart pattern has stocks price highs and stocks price lows which can be connected by small lines that are parallel, giving the bear pennant chart pattern the look of a small channel - inverted pennant.
How Do I Analyze Bear Pennant Chart Pattern? - How Do I Interpret Bear Pennant Chart Pattern
The bear pennant chart pattern above was just a consolidation period for stock trading market trend prior to more selling & resuming of the downward stocks trend. The continuation stocks trading signal from the bear pennant chart pattern was completed when the lower line of this bear pennant chart pattern was broken to the downside after which the stocks price moved downwards.
How Do I Analyze Bear Pennant Chart Pattern


