Stocks Trading Differentiate a Double Bottom Chart Pattern from a Double Top Chart Pattern
Stocks Trading Differentiate a Double Bottom Chart Pattern from a Double Top Chart Pattern
Trading Stock Identify and Trade Double Bottoms Chart Pattern and Double Tops Chart Pattern
A double tops chart pattern has an M shape and it occurs at a stocks market top hence its name double top chart pattern and it signals a bearish stocks price reversal in the stock trading market. Once a double top chart pattern is confirmed then the stocks market will be considered to be bearish, therefore a double top is bearish.
A double bottom trading pattern has a W shape and it occurs at a stocks market bottom hence its name double bottom chart pattern and it signals a bullish stocks price reversal in the stock trading market. Once a double bottom chart pattern is confirmed then the stocks market will be considered to be bullish, therefore a double bottom is bullish.
To identify double tops and double bottoms patterns the examples below explain the two stocks trading chart patterns:
Double Top Chart Pattern
Double tops stocks chart pattern is a reversal pattern which forms after an extended upwards stocks trend. As its name implies, this double top pattern formation is made up of 2 consecutive peaks which are roughly equal, with a moderate trough between.
This double tops pattern formation is considered complete once stocks price makes second peak & then penetrates lowest point between the highs, known as the neck line. The sell signal from this double top pattern formation occurs when the stocks market breaks-out below neck line.
In Stocks, this double tops chart pattern formation is used as a early warning signal that a bullish Stocks trend is about to reverse. However, double top pattern is only confirmed once the neckline is broken and the stocks market moves below the neckline. Neckline is just another name for last support level formed on the Stocks chart.
Summary:
- Double tops stocks pattern forms after an extended move upwards
- This double tops chart pattern formation indicates that there will be a reversal in the stock trading market
- We sell when the price breaks-out below neck-line: see below for explanation.
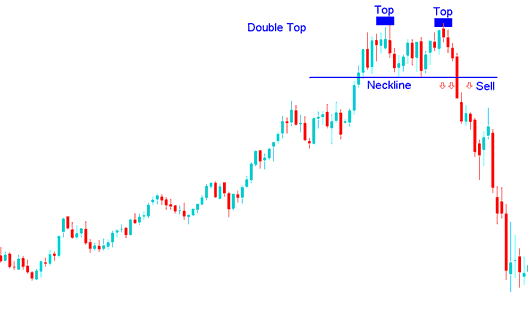
Double Tops Chart Pattern - How Can I Differentiate a Double Bottom from a Double Top?
Double Bottom Chart Pattern
Double bottoms stocks chart pattern is a reversal stocks pattern which forms after an extended downwards stocks trend. Double bottoms stocks pattern is made up of 2 consecutive troughs which are roughly equal, with a moderate peak between.
This double bottoms pattern formation is considered complete once stocks price makes second low & then penetrates highest point between the lows, known as the neck line. The buy indication from this bottoming out signal occurs when the stocks market breaks-out the neck line to the upside.
In Stocks, this double bottoms chart pattern formation is an early warning signal that the bearish Stocks trend is about to reverse. It is only considered complete/confirmed once the neckline is broken. In this double bottoms chart pattern formation the neckline is resistance level for stocks price. Once this resistance is broken the stocks market will move up.
Summary:
- Double bottom stocks pattern forms after an extended move downwards
- This Double bottoms stocks pattern formation indicates that there will be a reversal in the stocks market
- We buy when price breaks-out above the neck-line: see below for the explanation.
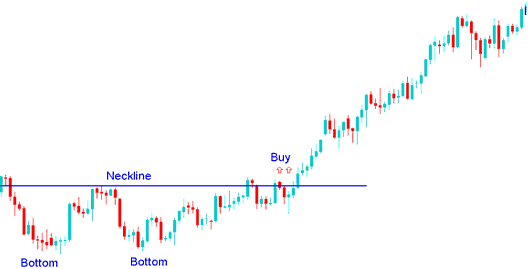
Double Bottom Chart Pattern - How Can I Differentiate a Double Bottoms from a Double Top?
Stocks Trading Differentiate a Double Bottom Chart Pattern from a Double Top Chart Pattern


