How Do I Analyze Stocks Trend Line Reversal Signals?
Trading Stocks Read Stocks Trend Line Reversal Signals
The Trend Line Stocks Indicator Reversal is a stocks reversal signal where the stocks market goes through the Trend Line Stock Indicator and starts moving in opposite direction.
Stocks Upwards Trend
When an Upward Stocks Trend Line Indicator is broken then the sentiment of the stocks market reverses & becomes bearish
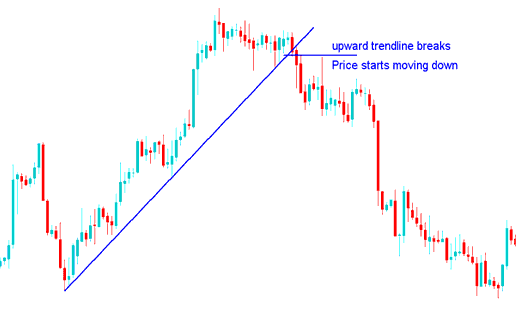
Upwards Stocks Trend Line Indicator Reversal - Upward Stocks Trend Line Indicator Reversal Stocks Technical Analysis
Stock Downwards Trend
When a Downwards Trend Line Stocks Indicator is broken then the sentiment reverses & becomes bullish
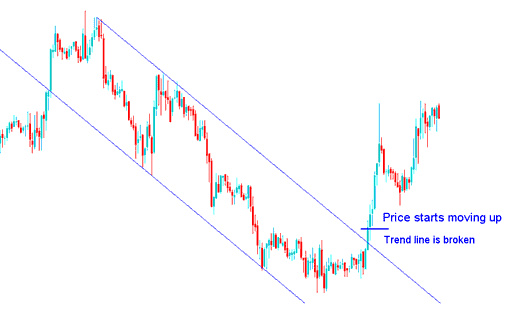
Downwards Stocks Trend-Line Indicator Reversal
NB: For very strong stocks trends, after this Stocks Trend Line Indicator Reversal stocks signal, the stocks price will consolidate for some time before heading in the opposite direction of the trend. For short term stocks trends then this Trend Line Stocks Indicator Reversal stocks signal will mean stocks price may reverse immediately.
MT4 Platform Stocks Trend-Line Technical Indicator Drawing Tools For Drawing Stocks Trendline Indicators in MetaTrader 4 Stock Charts
The MT4 Stocks Trend Line Indicator drawing tools used to draw Stocks Trend Line Indicators on the MT4 platform are located on the MT4 charts toolbar within the MT4 stock platform, To get this MT4 charts toolbar if it is not activated on your MT4 stock platform, Click in 'View' Next to 'File' menu at tops left corner of the MT4 stock platform and click the 'View', Then Click on 'Tool-bars' button key, Then Check 'Lines Tool-bar' by clicking on it.
Below is the stocks example of the stocks trading MT4 Trend Line Stocks Indicator drawing charts toolbar. To draw a stocks downward Stocks Trend Line Indicator on a stocks chart click on this Stocks Trend Line Indicator drawing tool and select the point where you want to draw the downward Trend Line Stock Indicator.
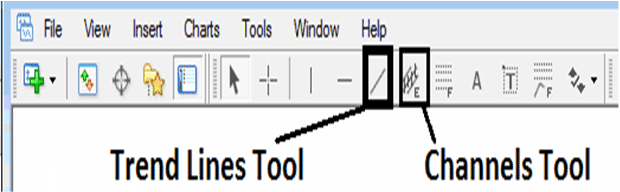
How Do You Draw Downward Stocks Trend Line Indicators in MT4
How Do I Analyze Stocks Trend Line Reversal Signals?


