How Do I Analyze Downwards Stocks Trend Reversal?
How to Analyze Downward Stocks Trend Reversal - How to Analyze a Stock Downwards Trend Reversal Technical Analysis
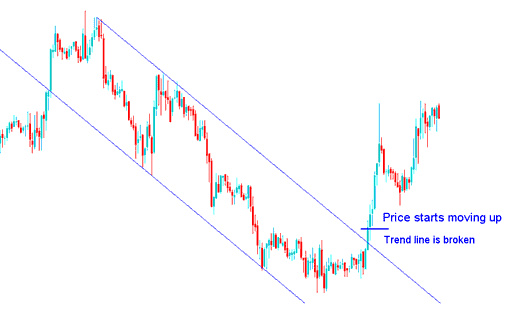
How to Interpret Downwards Stocks Trend Reversal Stock Trading Analysis
When stocks price breaks-out above the downwards trendline - trend line resistance level - the stocks price will then move up
How Do I Analyze Downwards Stocks Trend Reversal?
How to Interpret Downwards Stocks Trend Reversal Stock Trading Analysis
After stocks price has moved in a downward trend direction for an extended period of time within a stocks downward trend it reaches a point where it stops moving within this downward trend. When this happens we say that the downward trend line has been broken and stocks traders Analyze this as a stocks downward trend reversal signal.
Since the downward trend line is the point of resistance level and this point of resistance level has been broken after a stocks downward trend-line break - then stocks traders Analyze this as a stocks signal and will expect the stocks price to move towards the opposite direction upward - stocks trader will Analyze this as a downward trend reversal signal.
When this happens stocks traders will close open stocks sell orders which they had sold. This is referred to as taking profit.
This stocks downward trend reversal trading signal is considered to be confirmed with the formation of higher low in stocks price. This stocks downward trend reversal signal also provides a stocks setup to open a buy stocks trade once the downward trend line is broken - stocks downward trend line reversal stocks trade signal.
Note that sometimes when price breaks-out its stocks downward trend it might first of all consolidate before moving in the opposite direction. Either way it is always good to take profit when the stocks trend reverses.
How to Analyze Downward Stocks Trend Reversal Technical Analysis - To trade this downward trend reversal signal - as a trader once you open a new stocks trade in the direction of the trend reversal the stocks price should immediately move upward in that direction, in a stocks price break-out manner. This means that the stocks prices should immediately move upward in that direction of the stocks trading break out signal without much resistance.
If on the other hand the stocks price does not immediately move in the upward direction of the stocks price breakout then it's best to close all the buy stocks trade because it means that the downwards trend is still holding & it might still have some momentum.
Another stocks tip is to wait for the downward trend line to be broken and for the stocks price to close above the downward trend line so as to confirm this downward trend reversal signal.
What happens is that most traders open stock trades waiting for a stocks trading reversal way before the downward trend is broken, only for the stocks price to touch this downward trend line and for the current stocks downward trend direction to hold and the stocks price to continue moving within the current stocks market downwards trend that still has some momentum.
Therefore, when stocks this downward trend reversal signal it is best to wait until the stocks price break-out has been confirmed by stocks price closing above the downward trend line.
- Downward Stocks Trend Direction Reversal Technical Analysis - this downward trend reversal signal is confirmed once the stocks price closes above the downwards trendline, this should be the correct time to open a buy stocks trade, so as to avoid a stocks trading whipsaw.
How Do I Analyze Downwards Stocks Trend Reversal?


