
Chart Time-frames for Trading/Transacting Indices
In trading, pick the best chart timeframe for your plan. It fits your style and goals.
There are 4 ways to trade, and the way you choose to trade will decide which chart time frame you use when trading.
The 4 styles of are:
1. Scalping
2. Day trading
3. Swing trading
4. Position trading
Scalping
Scalping involves a trader dealing in large lot sizes with the objective of capitalizing on minimal market fluctuations. Scalpers open and close transactions rapidly, with typical positions remaining open only for a few seconds up to a few minutes - often under ten, sometimes under five minutes. For illustration, a scalper might trade with lot sizes of 50 and target take profits between 10 to 20 points. In the context of Indices, due to fractional points or pips, 10 points would equate to 100 points because the final listed point represents a fraction.
A typical trade executed under this approach will be held open for a very short duration, employing extremely tight stop placements. A scalper might set their stop loss orders merely 5, 6, or 7 pips away. This implies that scalpers predominantly trade in fast-moving market conditions, increasing the likelihood that a trade moves favorably and reaches its take profit target rapidly after being opened. Scalpers exit their trades quickly, often operating on the 1 Minute chart timeframe to capture fleeting market movements. Additionally, scalpers typically execute a high volume of trades daily, generally between 30 and 50 positions each day. This trading methodology demands individuals capable of making split-second decisions.
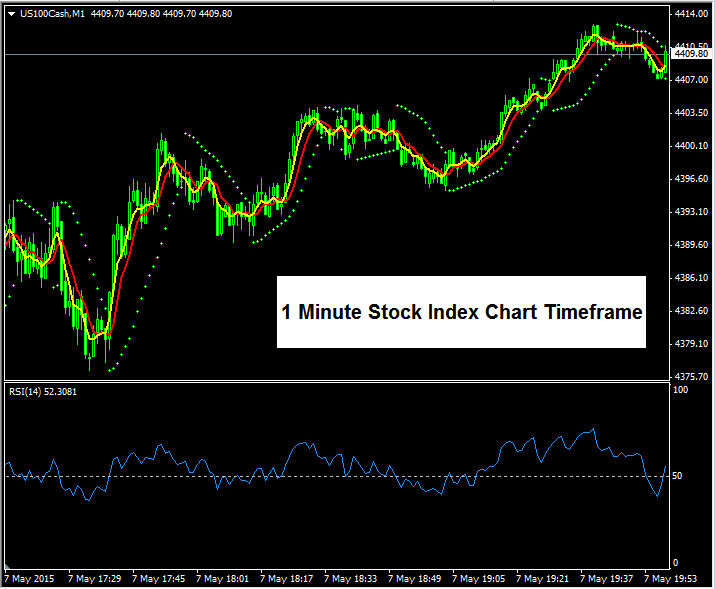
1 Minute Chart Time frame for Transacting
Day Trading
Day trading is the most liked trading method among all other trading methods, maybe scalpers may disagree but intraday trading is the most popular/liked. In day trading the stock indices traders will open trades with modest amount of lots & they aim to take profits from the intra-day trends which may move an average of 40 to 70 points. The day traders will open about 2 or 3 or 5 lots per trade & will set take profit targets of about 30 points up to 50 points. Day traders will aim for this number of pips every day and will only open 1 or 2 or 3 trades per day and not more. Day traders will also close all their trades at the end of the day even if their profit targets have not been reached; they close all their trade positions & wait to open others the following day. This is why this group of traders are called day traders - they only trade during the day and close all their trades at the end of the day.
Day traders rely on short-term charts like 15-minute or 1-hour ones. They pick based on their trading time and which chart gives the clearest signals for their system. To start day trading, practice with both time frames. Then choose what suits you best. Faster traders often use the 15-minute chart. Slower ones stick to the 1-hour frame.
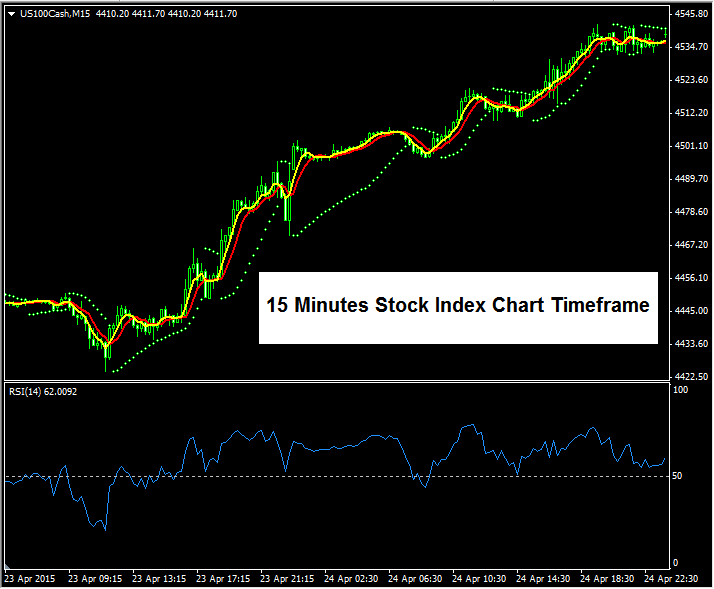
15 Minute Trading Chart Time frame - Intraday Trading
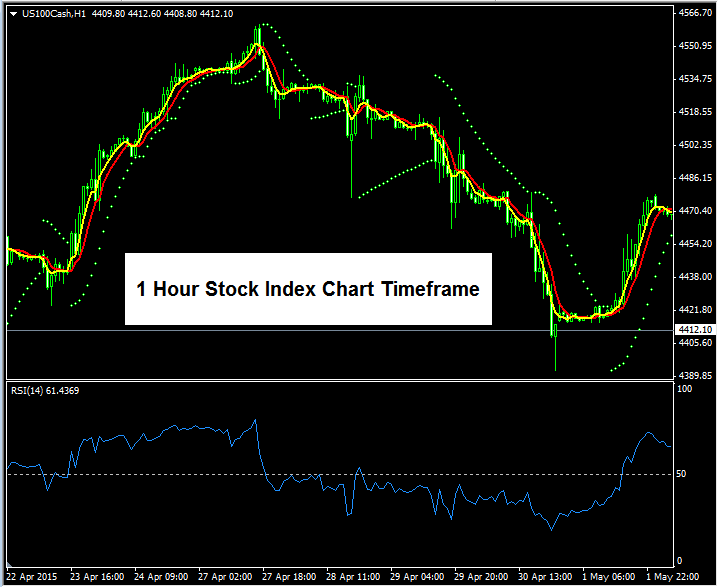
1H Chart Time Frame - Intraday Trading
Swing Trade
A swing method means opening trades and keeping them open for a few days to let them gain more power and profit. Swing traders keep their trades open overnight, and if you're new and don't know what you're doing, it's best to leave this to the experts because keeping trades open overnight is risky because the market could go the other way. Swing traders look at the 4-hour charts to understand the market's general direction and open trades that follow this direction. These trades will stay open for 3 to 5 days. Swing traders will open trades with 1, 2, or 3 lots, and their trades will stay open for several days. Day traders will only open 1, 2, or 3 trades each week and will mostly watch their open trades instead of placing new ones.
This specific approach readies the Stock Index trader for substantial price fluctuations, hence the classification as swing trading.
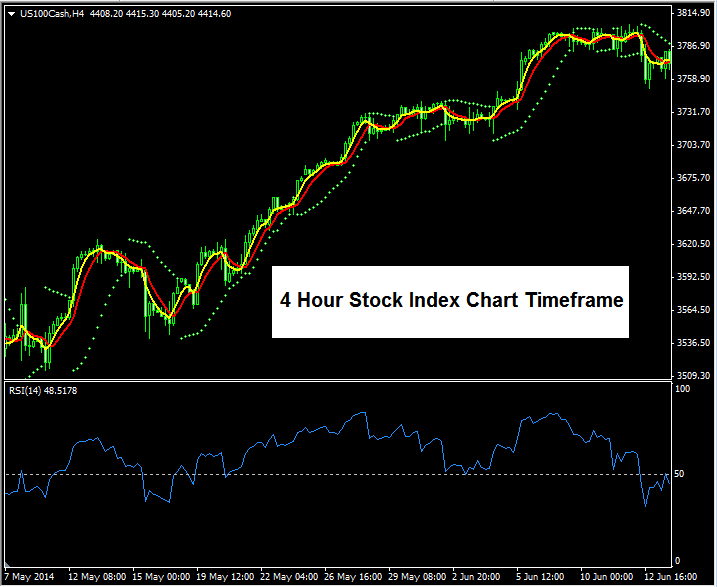
4 Hour Chart Time frame - Swing Trading
Position Trading
Position trading ranks last in popularity among trade methods. It feels more like investing than active trading. Users scan daily and weekly charts for lasting trends. They start positions and hold for months or years. The goal is to capture the trend's full strength. Yet wide swings pose risks. Markets can rebound and wipe out earnings. This explains its low use. Just a few traders follow it.
Where to Find Chart Time Frames on the Trade Software
To pick the timeframe for your chart, go to the "Charts" menu near file and view, and choose the "Periodicity" option, like what's shown here.
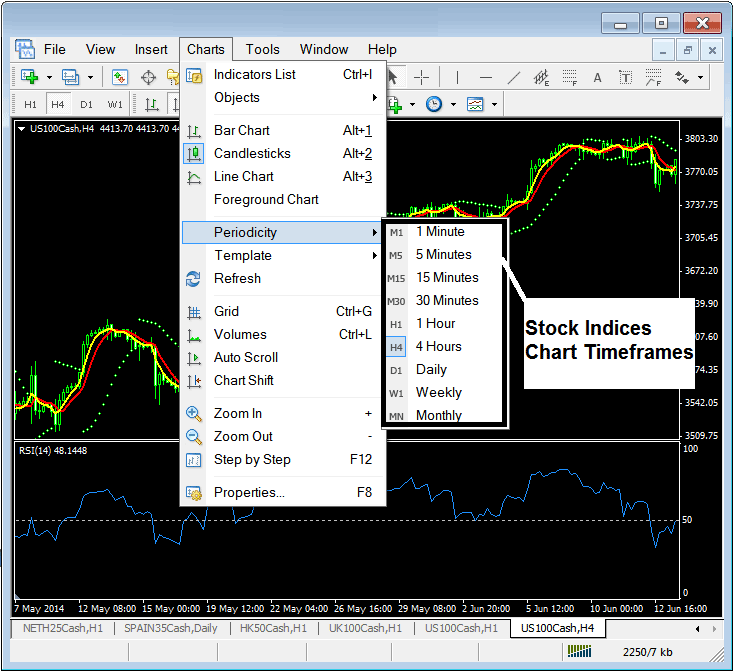
A stock index trader can use the periodicity menu above to adjust the trading chart's time frame to any time frame they want to use. The currently selected time frame is always highlighted: for example, the chart above is the 4H chart, and on the periodicity menu, the H4 next to the 4 hour chart is highlighted.
Get More Guides & Guides:
- Learning to Use the MetaTrader 4 Trading Platform
- Explain Trade Forex Market
- The Plan Training Instructions Lesson for Top Plan for Beginner Traders
- NETH 25 index trading: a strategy example.
- Optimal Trading Times for EURUSD in GMT
- What is the Method to Plot Decreasing Gold Trend-lines on XAU/USD Charts?
- FX EUR/PLN Pip Calculator for Trading