Spinning Tops Crude Oil Trading Candle-stick Patterns - Spinning Tops Consolidation Oil Candles Pattern
Spinning Tops Candlesticks Pattern
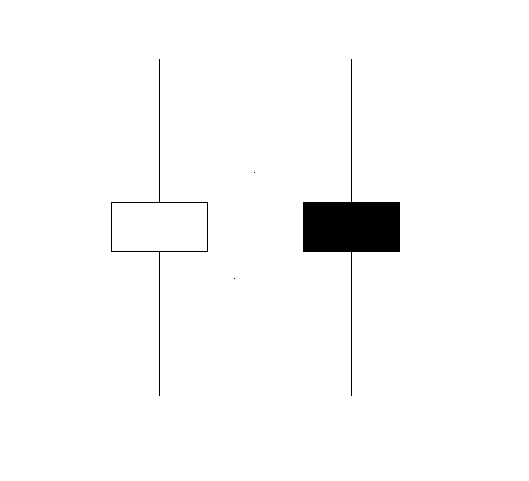
Spinning tops candles pattern have a small body with long upper and lower shadows. These spinning tops candlesticks pattern are referred by this name because these candlestick patterns are similar to spinning tops spinning on a matchstick.
The upper and lower shadows of the spinning tops candlesticks patternare longer than the body. The example explained below shows the spinning top candlesticks pattern. You can look for the spinning tops candles pattern in your MT4 oil charts. The example explained below shows a screenshot to help oil traders when it comes to learning and understanding these spinning tops candlesticks pattern formations.
How to Read Candlestick Oil Trading Charts Pattern - Spinning Tops Crude Oil Candle Stick Pattern - How to Trade Spinning Tops Crude Oil Candlesticks Patterns - How to Analyze Spinning Tops Candles Pattern
The color of the spinning top candles pattern isn't very important, this pattern show indecision between buyers & sellers in the Oil Trading market. When these spinning tops candlesticks patterns appear at the top of a oil trend or at the bottom of the oil trend it might signify that the oil trend is coming to an end and it might soon reverse & start going the other direction. However, it's best to wait for confirmation oil trading signals that the direction of a oil trend has reversed before trading the signal from this spinning top candle-sticks pattern formation.
Spinning Tops Candlestick Reversal Patterns Formations on oil trading Charts
At the top of an upwards oil trend a black/red spinning top candlestick pattern shows that a oil trend reversal is more likely than when the color is white/blue.
At the bottom of a Oil Trading downward oil trend a white/blue spinning top candlestick pattern shows that a oil trend reversal is more likely than when the color is black/red.
This spinning top candlestick pattern reversal oil signal is confirmed when the next oil candlestick that forms after the spinning tops candlestick pattern closes below the neckline of the spinning tops candlestick pattern for a downward oil trend reversal oil signal confirmation, and closes above the neckline of the spinning tops candlestick pattern for a reversal oil signal in a oil downwards trend.
The spinning tops candles pattern neckline is:
- For an Upward Oil Trading Trend - The open of the previous candle which was drawn just before spinning top candle pattern.
- For a Downward Oil Trading Trend - The open of the previous candle which was drawn just before spinning top candle pattern
Below is an example of this Japanese candlestick oil charting techniques where this spinning tops candlesticks pattern has formed and how to trade it. On the oil chart below when the crude oil price moved above the neckline the oil trend reversal oil signal given by the spinning tops candlestick pattern was confirmed and this was a good point to exit the short sell oil trade transaction.
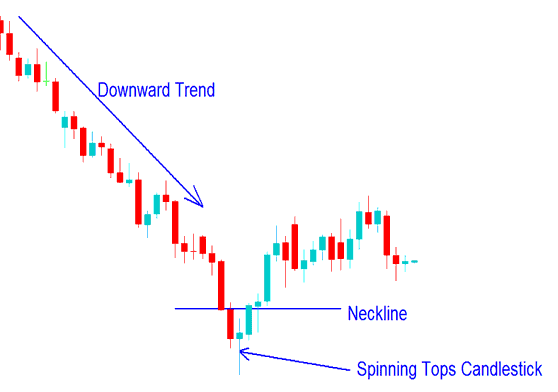
Spinning Tops Candles Pattern on a Chart - Spinning Tops Crude Oil Trading Candle-stick Patterns - Spinning Tops Consolidation Crude Oil Candlesticks Pattern - Reversal Crude Oil Candle Stick Patterns
The color of the spinning tops candlestick pattern formed is blue therefore meaning that a oil trading reversal was more likely as opposed to if the color of the spinning tops candle pattern had been red.


