What Does Reversal Chart Pattern Mean? - The 4 Reversal Chart Patterns Explained with Examples
Reversal Patterns confirm the reversal of the forex market trend once this reversal chart pattern setup is confirmed.
These reversal patterns are formed after extended forex market trend either upwards or downward & these reversal patterns signal that the forex market trend is ready to reverse.
1. Reversal Chart Patterns
- Double Tops Reversal Chart Patterns
- Double Bottom Reversal Patterns
- Head and Shoulders Reversal Chart Patterns
- Reverse Head and Shoulders Reversal Chart Patterns
Double Tops
Double tops pattern is a reversal pattern which forms after an extended uptrend. As its name implies, this formation is made up of two consecutive peaks that are roughly equal, with a moderate trough between.
Summary:
- Double tops chart pattern forms after an extended move upwards
- Double tops pattern formation indicates that there will be a reversal in market
- We sell when the price breaks below the neckline: see below for explanation.
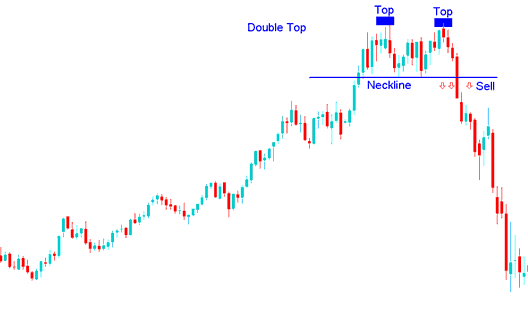
Example of Double Tops Reversal Chart Pattern on a Chart
Double Bottom
Double bottoms pattern is a reversal pattern which forms after an extended downtrend. It is made up of two consecutive troughs that are roughly equal, with a moderate peak between.
Summary:
- Double bottom chart pattern forms after an extended move downwards
- Double bottom pattern formation indicates that there will be a reversal in market
- We buy when price breaks above the neckline: see below for explanation.
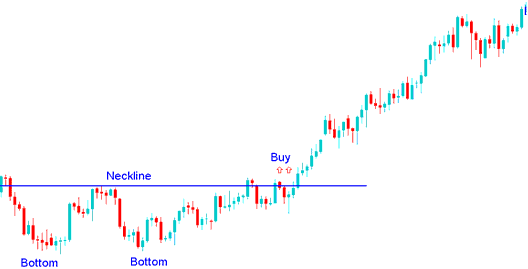
Example of Double Bottoms Reversal Chart Pattern on a Chart
Head & Shoulders Chart Pattern
Head and Shoulders pattern is a reversal pattern which forms after an extended Forex uptrend. It is made up of three consecutive peaks, left shoulder, head & right shoulder with two moderate troughs between the shoulders.
Summary:
- Head & Shoulders pattern forms after an extended move upward
- Head & Shoulders pattern formation indicates that there will be a reversal in market
- Head & Shoulders chart pattern formation resembles head with shoulders thus its name.
- To plot the neck line we use chart point 1 and point 2 as shown below. We also extend this line in both directions.
- We sell when the price breaks below the neckline: see the chart below for explanation.
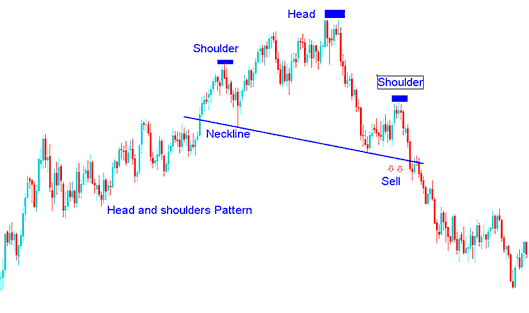
Examples of Head & Shoulders Reversal Chart Pattern on a Chart
Reverse Head and Shoulders Chart Pattern
Reverse Head and Shoulders pattern is a reversal head & shoulders chart pattern which forms after an extended Forex downtrend. It resembles an upside-down head shoulders.
Summary:
- Reverse Head and Shoulders pattern forms after an extended move downward
- Reverse Head and Shoulders pattern formation indicates that there will be a reversal in market
- Reverse Head & Shoulders pattern formation resembles upside down, thus the name Reverse.
- We buy when price breaks above the neckline: see the chart below for explanation.
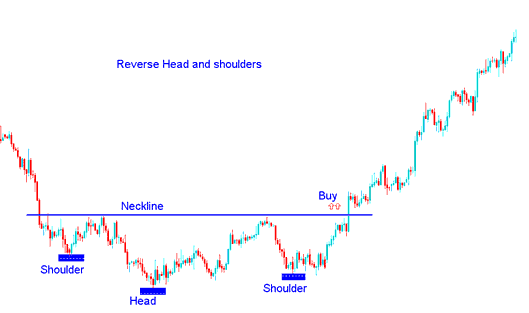
Example of Reverse Head and Shoulders Reversal Chart Pattern on a Chart
Reversal Chart Patterns Guides
Double Tops Chart Patterns & Double Bottom Chart Patterns
Head and Shoulders Chart Patterns & Reverse Head & Shoulders Chart Patterns


