Linear Regression Slope Technical Analysis Signals
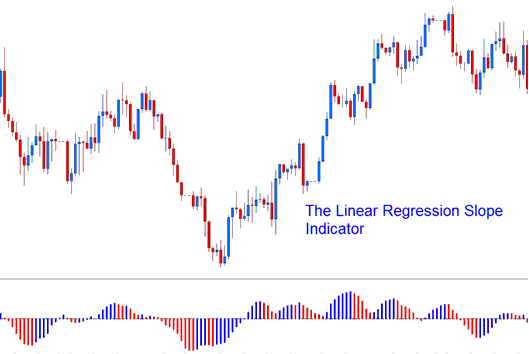
Linear Regression Slope calculates the slope/gradient value of regression lines which involves the current price bar & the previous n-1 price bar (where n = regression periods)
This indicator computes this specific value and refreshes it for every price candle that is loaded onto the chart.
The Indicator is calculated using the Linear Regression Trading Indicator. The linear regression plots the trend of the market price price chart over a specified and given duration of time and this trend is determined by drawing a Linear Regression Trendline using "least squares fit" method. The slope of this trend-line is then calculated and this forms the linear regression.

Linear Regression Slope
The slope values are then smoothed by multiplying the raw slope indicator values by 100 & then dividing this value by price
Linear Slope Regression = (raw value of slope * 100 / price).
Smoothing slope values matters for volatile markets. They trade in wide price ranges per candlestick. A smoothed slope shows the percent price change per candle. It uses the best fit line for calculations.
Forex Technical Analysis and How to Generate Signals
- If the smoothing out of the slope is 0.30, then the regression line is rising and adjusting at a rate of 0.30 % for every candlestick.
- If the smoothing of the slope of -0.30, then the regression line is going downward & adjusting at the rate of -0.30% for every candlestick.
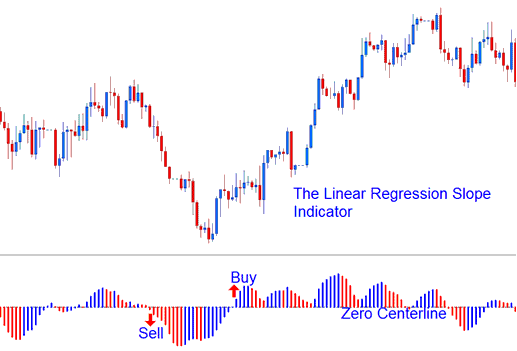
The slope resulting from the regression is depicted as a histogram featuring two colors, shifting above and below a zero reference line. This centerline, which triggers signals, is positioned precisely at the zero mark.
- A rising slope (greater than the previous value of 1 candlestick ago) is displayed and shown in the Blue/Upwards Slope colour,
- A declining slope (lower than the previous value of 1 candlestick ago) is shown & displayed in the Red/Downwards Slope color.

Analysis in Forex Trading
Get More Topics and Tutorials and Lessons:
- How to work with ROC MetaTrader 5 Forex Indicator.
- Choosing a Broker to Trade Nikkei 225 Effectively
- Forex Trading with the TSI True Strength Index Automated Trading Setup
- How Buy Entry and Sell Entry Limit Orders Work
- What time does the Dow Jones 30 index open?
- Chande's Momentum Oscillator on MetaTrader 5
- Need a guide lesson for NKY225 strategies? Download it here.
- Exploring MT4 History Center via the Tools Menu on the MetaTrader 4 Platform
- Learning to Trade XAU/USD: Course Tutorial
- Configuration Process for a Commodity Channel Index (CCI) Expert Advisor (EA)
