How to Add Rate of Change Indicator on MetaTrader 4 Charts - Adding MT4 ROC Indicator
Step 1: Open Navigator Window on FX Trading Platform
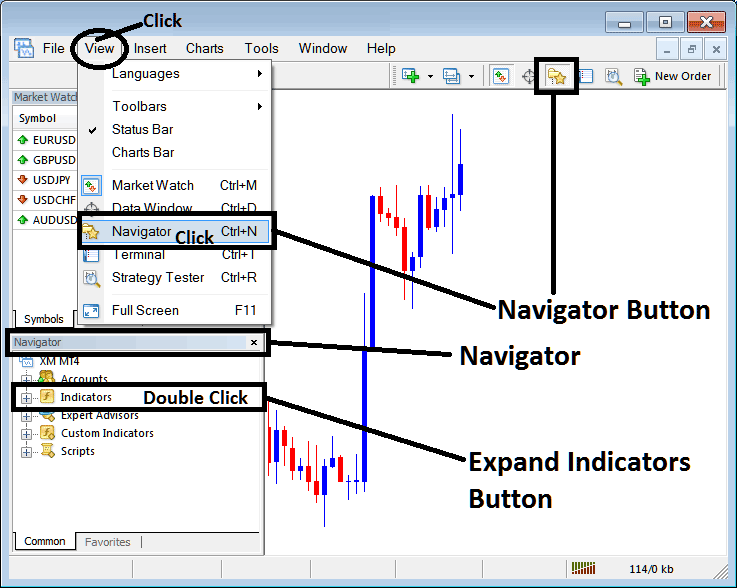
Open Navigator window as shown & illustrated below: Go to 'View' menu (click on it), then select 'Navigator' window (click), or From Standard Tool Bar click the 'Navigator' button or press keyboard short cut keys 'Ctrl+N'
On Navigator window, choose 'Indicators', (Double-Click)
How to Add Rate of Change, ROC Indicator on MetaTrader 4 - MT4 Rate of Change, ROC Indicator
Step 2: Expand the Indicators Menu on the Navigator - Adding Rate of Change, ROC MT4 Indicator
Expand the menu by clicking the expand button marker (+) or double click the 'indicators' menu, after this the button will appear as (-) and will now display a list as shown below - select the Rate of Change, ROC forex chart indicator from this list of forex indicators so as to add the Rate of Change, ROC indicator on the forex chart.
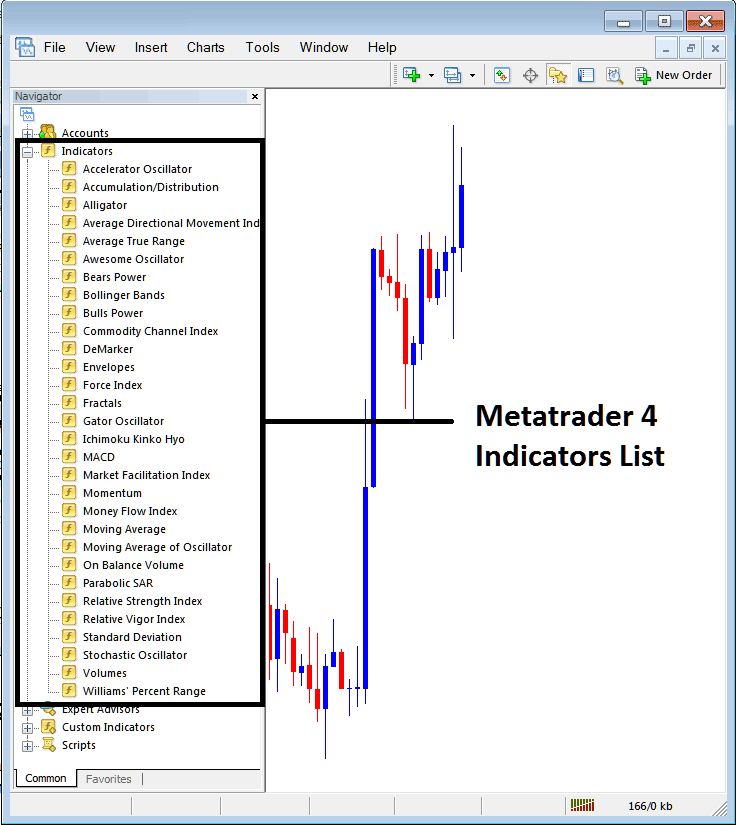
How to Add Rate of Change, ROC Indicator - From the Above window you can then place Rate of Change, ROC indicator that you want on the Forex chart
How to Add Custom Rate of Change, ROC Indicator to MT4
If the technical indicator you want to add is a custom indicator - for example if the Rate of Change, ROC technical indicator you want to add is a custom indicator you will need to first add this custom Rate of Change, ROC indicator on the MT4 platform & then compile custom Rate of Change, ROC indicator so that the newly added Rate of Change, ROC custom indicator pops up on the list of custom indicators in MetaTrader 4 software.
To learn how to install Rate of Change, ROC indicators on MT4, how to add Rate of Change, ROC indicator window to MT4 and how to add Rate of Change, ROC custom indicator in MT4 - How to add a custom Rate of Change, ROC indicator in MetaTrader 4.
About Rate of Change, ROC Technical Indicator Explained
Rate of Change Technical Analysis and Rate of Change Signals
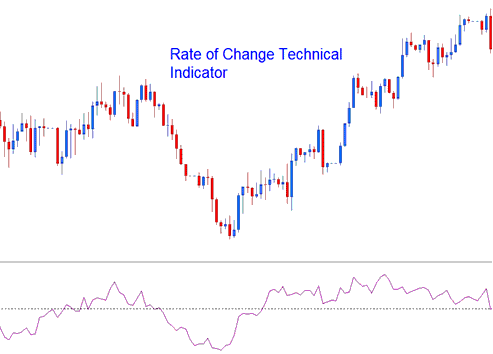
Rate of Change, ROC indicator is used to calculate how much price has changed within a specified number of price periods. It calculates the difference between the current candlestick and the price of a chosen number of previous candles.
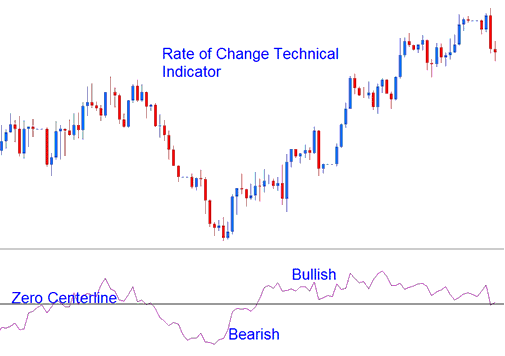
The difference can be calculated using Points or Percents. Rate of Change moves in an oscillation manner, where it oscillates above and below a zero center-line level. Levels above zero are bullish while those below zero center-line level are bearish.
The greater the changes are in the prices the greater the changes in the ROC.
FX Technical Analysis & Generating Signals
Rate of Change indicator can be used to generate Forex signals using a number of methods, the most common ones are:
FX Crossover Signals
Bullish Signal - buy signal is generated when ROC crosses above zero center line
Bearish Signal - sell trading signal is generated when Rate of Change crosses below zero center-line.
Overbought/Oversold Levels:
Overbought - The higher the reading the more overbought a currency pair is. Values that are above the overbought level imply that a currency is overbought and there is a pending price correction
Oversold - The lower the reading the more oversold a currency pair is. Values below the oversold level imply that a currency is oversold and there is a pending price rally.
However, during strong trending markets the price will remain in the Overbought/Oversold Levels for a long time, and rather than the price reversing the price trend will continue for quite some time. It is therefore best to use the crossover signals as the official buy & sell signals.
FX Trading Trend Line Breaks
Trend lines can be drawn on ROC indicator just the same way trend lines can be drawn on price charts. Because The Rate of Change is a leading indicator, the trend lines on the indicator will be broken before those on the price charts. A trend-line break on the Rate of Change is an indication of a bullish or bearish reversal signal.
- Bearish reversal- Rate of Change readings breaking above a downwards Forex trendline warns of a likely bullish reversal.
- Bearish reversal- Rate of Change readings breaking below an upwards trendline warns of a likely bearish reversal.
Forex Divergence FX Trading
Rate of Change can be used to trade divergences, and to identify potential trend reversal signals. There are four types of divergences: classic bullish, classic bearish, hidden bullish and hidden bearish divergence.


