How to Set MetaTrader 5 Bollinger Bandwidth Indicator on MetaTrader 5 Charts
Step 1: Open MT5 Navigator Window
Open MT5 Navigator window as presented in the MT5 illustration put on display below: Go to the 'View' menu (press), then select the 'Navigator' window (press), or From Standard Toolbar click 'Navigator' button or press key board MetaTrader 5 shortcut keys 'Ctrl+N'
On MT5 Navigator window, choose and select "Indicators", by DoubleClick
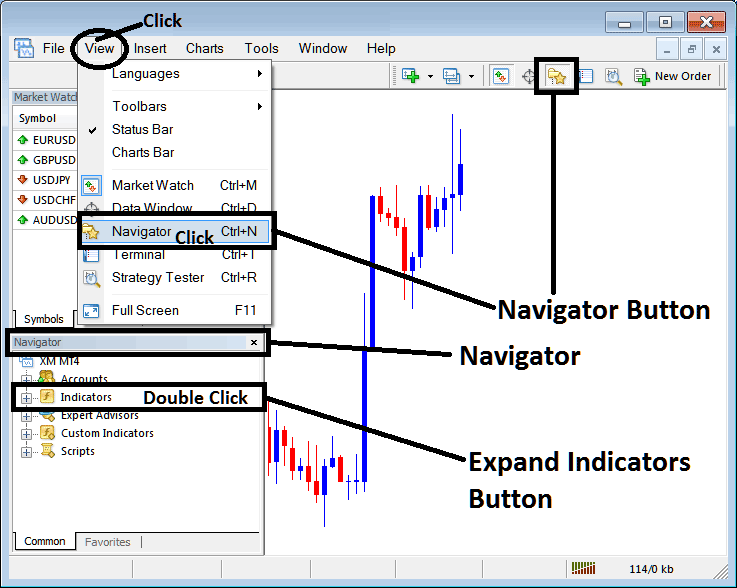
How Do You Use MT5 Bollinger Bandwidth Indicator in the MT5?
How to Set Bollinger Bandwidth MT5 Indicator
Expand this menu by clicking the magnify(+) button (+) or doubleclick the 'indicators' menu, after that this particular button will be displayed as (-) & will now display MetaTrader 5 indicators list as presented on the MT5 illustration below - select the Bollinger Bandwidth indicator from this listing of MetaTrader 5 indicators so that as you as a trader can add the Bollinger Bandwidth MT5 indicator in the MT5 chart.
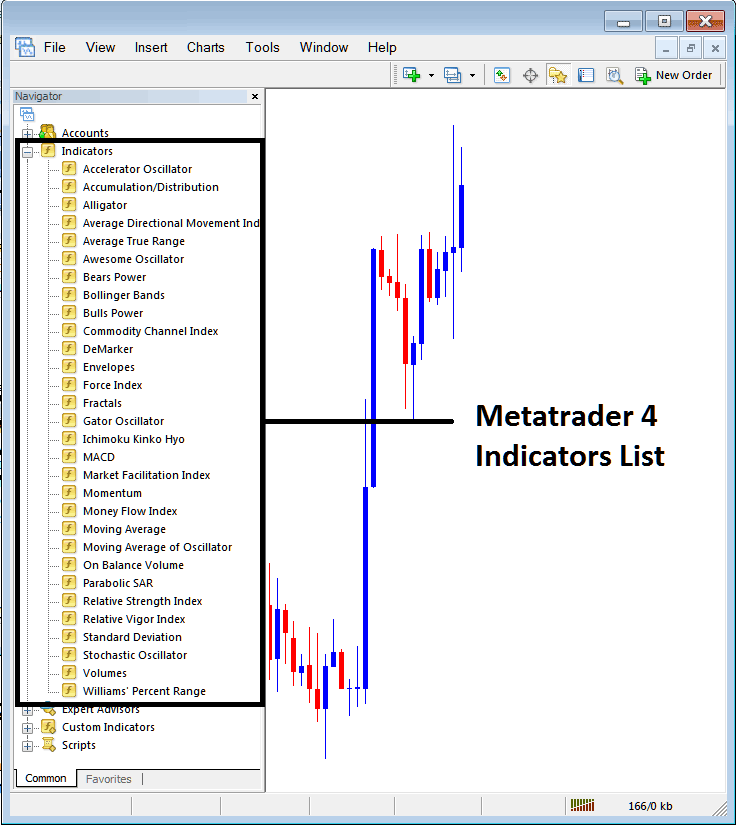
How Do You Use MetaTrader 5 Bollinger Bandwidth Indicator on the MT5?
How to Add Forex Custom Bollinger Bandwidth Indicator in Meta Trader 5
If the MT5 indicator that you want to add in the MetaTrader 5 charts is a custom MT5 technical indicator - for example if the Bollinger Bandwidth indicator that you want to add is a custom MT5 technical indicator you'll need to first add this custom Bollinger Bandwidth MT5 indicator in the MT5 software & then compile custom Bollinger Bandwidth indicator so that as the newly added Bollinger Bandwidth MT5 custom indicator pops up on the list of custom indicators in the MT5.
To learn how to add Bollinger Bandwidth indicators on MT5 software - how do you place Bollinger Bandwidth indicator window to MT5 software? - how do you place Bollinger Bandwidth forex custom indicator on MetaTrader 5 software? - How to add custom Bollinger Bandwidth custom indicator in MT5 Platform Software.
How Do You Use Bollinger Bandwidth MT5 Indicator?
Bollinger Bandwidth Analysis Buy and Sell Signals
Created and Developed by John Bollinger.
Bollinger Bandwidth is derived from the original and initial Bollinger Band indicator.
Bandwidth is a measure of width of Bollinger Band
Calculation of Bollinger Bandwidth Indicator
Band-width = Upper Band - Lower Band
Middle Band
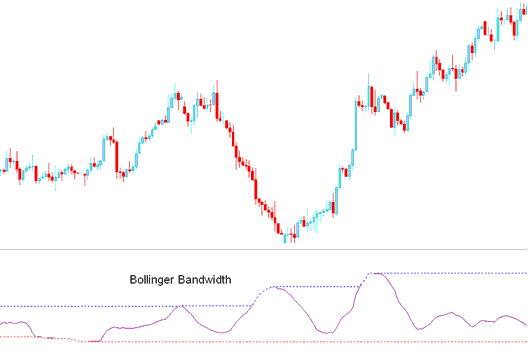
How Do You Add MT5 Bollinger Bandwidth Indicator on MetaTrader 5 Charts
Bollinger Bandwidth indicator is an oscillator that is based on the theory that forex price & volatility occurs in cycles.
Periods of high forex price volatility are followed by the periods of low price volatility.
When price volatility is high - Bollinger Band are far apart, the Bollinger Bandwidth will also be wide apart.
When price volatility is low - Bollinger Bands are narrow & the Bollinger Bandwidth also will be narrow.
The Bollinger Bandwidth blue line represents the highest Bandwidth value for a previous number of price periods.
This Bollinger Bandwidth indicator blue line also identifies periods of high forex price volatility
The Bollinger Bandwidth red line represents the lowest Band-width value for a previous number of price periods.
This Bollinger Bandwidth red line also identifies the periods of low price volatility
How to Generate Buy & Sell Signals
Forex Price Consolidation
Bollinger Bandwidth is used to identify the Bollinger Band squeeze, which is a period of price consolidation - after which there is a price break-out in a particular direction.
Bollinger Bandwidth signals are derived & generated when there is a price breakout signal - which gets generated/derived by Bollinger Bandwidth starting to go up after touching the red line. When the Bollinger Bandwidth line starts and begins to move up it signifies that fx volatility is rising as the forex price is breaking out.
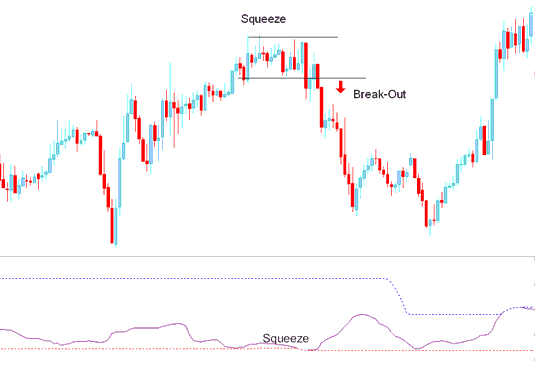
Bollinger Bandwidth Squeeze
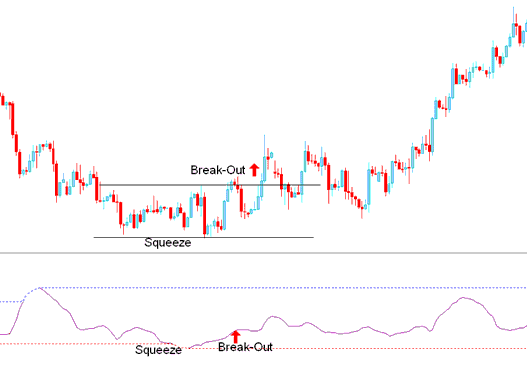
However, Bollinger Bandwidth indicator is a directionless forex indicator & thus it needs to be combined with another technical indicator such as the moving average to determine the direction of the trend/ price break-out.
How Do I Use MetaTrader 5 Bollinger Bandwidth on MT5 Software Platform?
More Tutorials & Lessons:
- Standard Trading Account and Micro XAU USD Accounts Types Explained
- RSI Swing Failure in Upwards and Downwards Trend
- Buy Limit Order and Sell Limit Order
- What is McClellan Histogram Indicator?
- How to Get and Find US 100 on MT4 PC
- How to Build a Moving Average MA Envelopes Strategy
- How to Understand Stock Index Signals


