How Do I Analyze Fibonacci Retracement Levels Forex Technical Analysis?
How Do You Trade Fibonacci Retracement Levels Forex Technical Analysis?
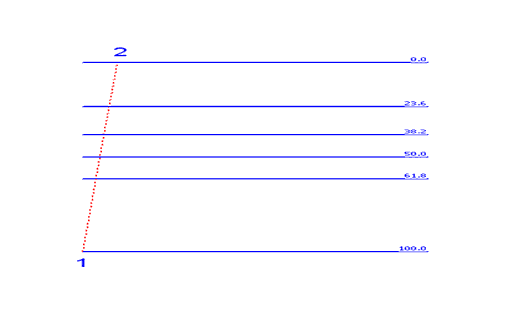
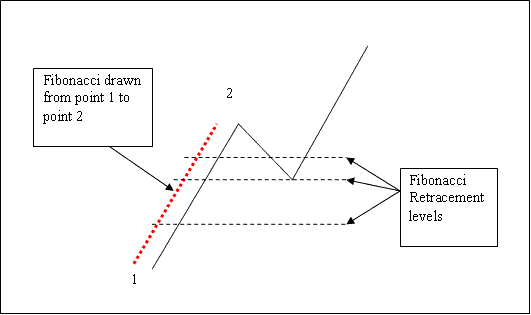
The Fibonacci retracement levels are explained below: traders should use this Fibonacci Retracement Levels indicator to determine where to open a forex trade whether a buy forex trade in a upward trend and a sell forex trade in a downward trend.
How Do I Use Fibo Retracement Levels for Day Trading?
How Do I Use Fibo Retracement Levels for Day Trading?
How Do I Use Fibo Retracement Levels for Day Trading?
How Do I Use Fibo Retracement Levels for Day Trading?
How Do You Use Forex Trading Fib Retracement?
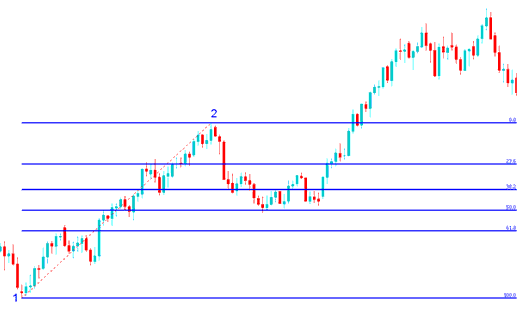
In the technical analysis forex trading example below the forex price is moving up between chart point 1 and chart point 2 then after chart point 2 it retraces down to 50.0% Fibonacci retracement level then forex price continues moving up in original upward trend. Note that this forex price retracement indicator is plotted from point 1 to point 2 in the direction of the Forex trend (Upward Direction).
How Do You Use Fibo Retracement in an Upwards Forex Trend?
How Do You Use Fibonacci Retracement in an Up Forex Trend?
Once the forex price hit the 50.0% Fibonacci retracement level, this Fibonacci retracement level provided a lot of support for the forex price, & afterward the forex market then resumed the original upward trend & continued to move upward.
For this technical analysis forex trading example, the forex price retracement reached the 50.0% Fibonacci retracement level, but most of the time the market will retrace up to 38.2% Fibonacci retracement level and therefore most of the time forex traders set their buy limit orders at 38.2% Fibo retracement level, while at same time placing a stop just below 61.8% Fibo retracement level.
How Do You Use Forex Trading Fib Retracement?
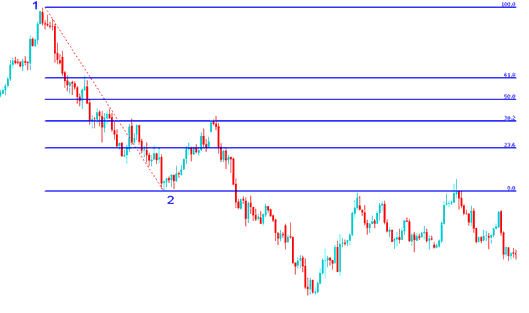
In the Forex Retracement Strategy forex trading example below the forex market is heading down between chart point 1 & chart point 2, then after chart point 2 the forex price then retraces up to 38.2% Fibonacci retracement level then it continues moving downward in the original downward trend. Note that this forex price retracement indicator is drawn from chart point 1 to chart point 2 in direction of the Forex trend (Downward Direction).
How Do You Use Fibonacci Retracement in a Downward Forex Trend?
How Do You Use Fibonacci Retracement in a Downwards Forex Trend?
The above technical analysis forex trading example is a forex price retracement trading set up where the price retraces immediately after touching the 38.20% Fibonacci Retracement Level.
In this technical analysis forex trading example the forex price retracement of forex price reached 38.20% Fibonacci retracement level & did not get to 50.00% Fibonacci retracement level. It is always good to use 38.20% Fibo retracement level because most times the forex price retracement does not always get to 50.00% Fibonacci retracement level.
This Forex Retracement level provided a lot of resistance for the forex price retracement, this was the best place for a trader to set a sell limit order as a market quickly moved down after hitting this Fibonacci retracement level.
How Do You Interpret Fibonacci Retracement Levels Forex Technical Analysis?


