How Do You Trade Swing Trade with Different Chart Timeframes?
How Do I Analyze Swing Trade with Different Chart Timeframes?
Swing Traders
This swing trading group holds onto their trades for a few days to a week. With the objective to make a big number of pips, 100 - 400 pips.
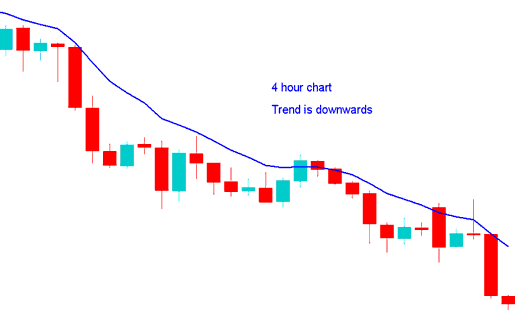
Swing trader using 1 hour chart time frame wants to go short, checks 4 hour chart time frame, that resembles the example below, since 4 hour highlights the trend is heading down, then decides from the analysis it's okay to sell.

Forex Swing Trading on Multiple Chart Time Frames - 15 Minute Swing Trading Strategy
Forex Swing Trader traders using analysis use charts to try & attempt to predict the movement of price on the charts.
Forex Swing traders will sometimes use two or more chart time frames so as to determine the long-term trend and the short term trend.
How Do You Define A Forex Price Trend for Swing Trading?
Using a system that has Three indicators - Moving Average Cross-over Trading System, RSI Indicator & MACD Indicator and using simple trading rules to define the trend. The trading rules are:
Upwards Trend
Both MAs Moving Up
RSI Indicator above 50
MACD Indicator Above Center-Line
Down-wards Trend
Both MAs Moving Down
RSI Indicator below 50
MACD Indicator Below Center-Line
Multiple charts time frames analysis equals using 2 chart time frames to trade instruments - a shorter chart time frame used for trading & a longer chart time frame to check the trend - the time frames that you select for trading price action with will depend on the type of trader you are: for Swing Traders the chart time frames used for trading will be example of 1 hour chart time frame and 4 H chart time frame.
Since it's always good to follow the trend when Swing Trading, in Multiple Chart Timeframe Analysis, the longer 4 hour chart time frame gives us the direction of the long-term trend when Swing Trading using the 1 hour Chart Timeframe.
How Do You Swing Trade with Different Chart Time Frames?


