How Do I Analyze Downward Forex Trend-Lines on Charts?
How Do You Trade Downwards Forex Trend-Lines on Charts?
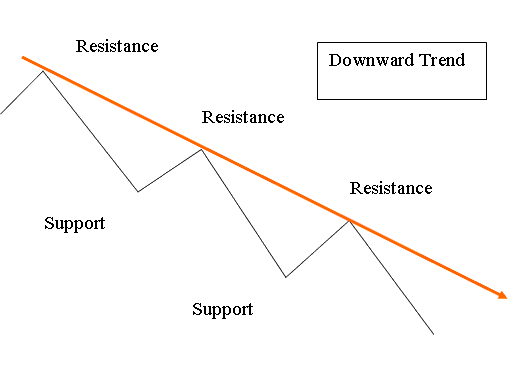
A downward forex trend line is formed by consecutive lower highs on the forex price chart - the downward forex trend line is drawn downwards connecting these lower highs - the downward forex trend-line must connect at-least two forex price highs - with the most recent forex price high being lower.
Because forex price moves downward in a zigzag manner - traders will draw a downward forex trend line showing the general downwards forex price direction. In forex technical analysis - this general direction of forex price is known as the Forex Trend. In forex technical analysis - forex downward trend-line is drawn on forex chart showing the resistance levels.
How Do You Interpret Downward Forex Trend-Lines on Charts?
A forex downward trend occurs when the price makes a series of lower price highs & lower price lows. Each forex price high is lower than the previous forex price high - lower high, and each forex price low is lower than the previous forex price low - lower low therefore showing a downward movement of forex price.
How Do I Analyze Downward Forex Trend-Lines on Charts?
Forex downward trend lines gain more validity each time the forex price touches the downward forex trend line but doesn't penetrate the downward trend line. A downward trend remains the general direction of forex price movement until this series of lower highs and lower lows is broken.
In forex technical analysis - An upside penetration of a forex downward trend line is interpreted as a reversal forex signal, and is interpreted that the bearish downward movement of forex prices may soon reverse.
How Do I Interpret Downwards Forex Trend Lines on Charts?
To learn how to draw and analyze forex downward trend, you need to know that in forex trading when the forex trend is bearish it forms lower lows and lower highs on the forex price chart - forming a downward general market movement direction. These are the chart points that are used to plot the downward forex trend line.
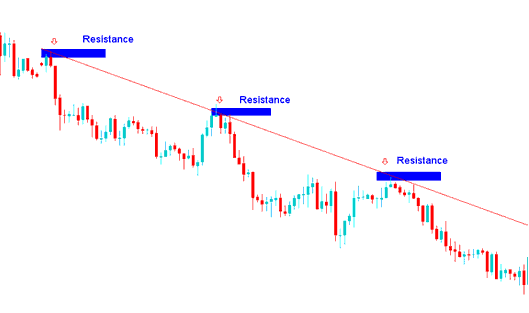
To draw the downwards forex trend line - traders use resistance levels and to draw the downward trend line correctly two resistance levels are required. When the forex price touches this downward trend-line - traders will open sell forex trades & place stop loss orders just a few pips above the downward forex trend line:
How Do You Interpret Downward Forex Trend-Lines on Charts?
How Do You Trade Downwards Forex Trend-Lines on Charts?
When trading with this downward trend line method - the general direction of the market is interpreted as downwards and therefore forex traders will only open sell forex trades when trading this downwards trend line setup. The downward trend line shows the levels where if the forex price retraces then these levels will provide strong resistance. This is why these levels are used by many traders to determine when to open sell forex trades. Forex trades opened at these levels will have a high Risk to Reward Ratio with minimum draw down - minimum forex price retracement.
For example, in the above forex downward trend line example - a trader would have generated sell signals at the resistance 1, resistance 2, resistance 3 and these sell signal would have made good forex trades with minimum amount of draw down (forex price retracement).
Downwards Forex Trend Lines
The MT4 forex tools to draw these trend lines in MetaTrader 4 forex charts are found on the Lines Toolbar within the MT4 platform, to access this MT4 tool bar if it is not activated on your MT4 Forex Platform, Click in "View" Next to "File" at the top left corner of MetaTrader 4 Forex Platform & click View, Then Click on the Toolbars, Then Check the Lines Toolbar by clicking on it.
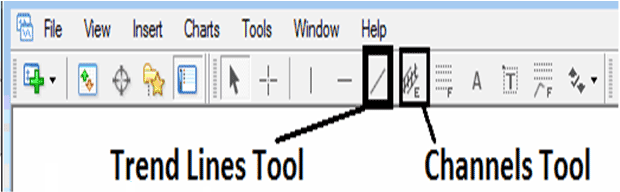
Shown Below is the explanation of these MT4 trend line drawing tools: just click on this MT4 trend lines drawing tool and select the points where you want to place this forex trend lines on the forex chart.
MetaTrader 4 Technical Analysis Charts
How Do I Analyze Downwards Forex Trend Lines on Charts?
MT4 Charts Toolbar - MT4 Tools for Analyzing Forex Trend Lines used to draw forex trend lines is shown above - to draw these trend lines - select the above MT4 forex trend-line plotting tool and select the two chart points where you want to plot the downward trend line.
Trend line forex trading strategy is one of the most popular forex technical analysis methods used by traders to analyze and read forex trend moves.
How Do You Interpret Downward Forex Trend-Lines on Charts?


