Drawing Bar Charts in MetaTrader 4
The third option on the charts menu in MetaTrader 4 platform is the "Bar Chart" button. This button key is used to choose the drawing method of currency pair movement as price bars.
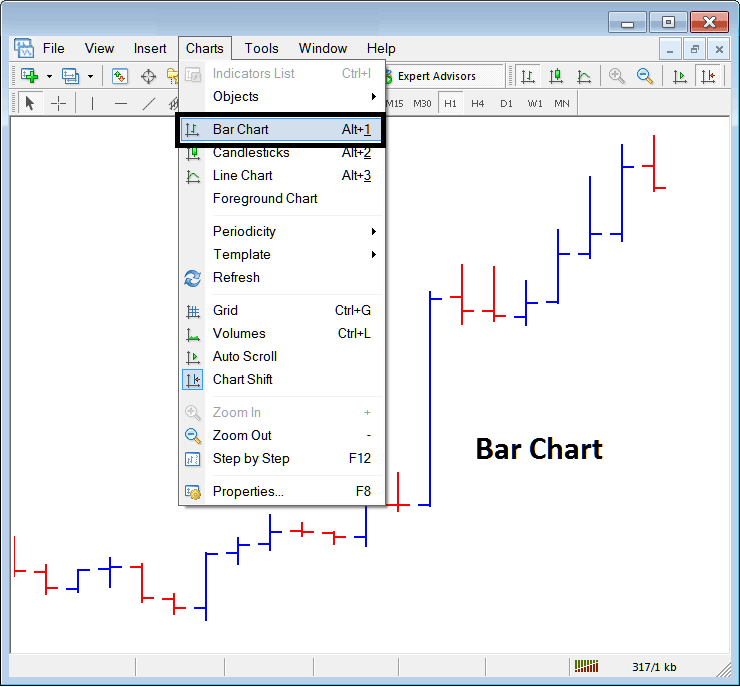
To trade currencies a trader may prefer to use the Bar Charts. The above menu button shows how a trader can select this option on the MetaTrader 4 software.
These are drawn using color programming:
- Red bar - Price went down
- Blue bar - Price market went up
These bars also have horizontal line to the left & to the right: these are used to show the opening (left horizontal dash) & closing (right horizontal dash).
highest point shows the high of the price
The Lowest point shows the low of the price
These four points Open, High, Close & Low are Known as O.H.C.L, the abbreviation of first letter for these four levels, these Four OHCL zones will be represented on each & every single price bar.
These charts are not very popular among Forex traders as they are not very appealing in terms of technical analysis & traders tend to favor other types.


