Support and Resistance Analysis and Signals
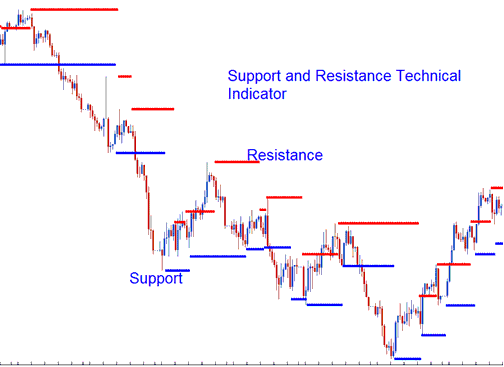
Support and Resistance constitutes one of the most frequently employed analytical concepts in XAUUSD trading, where most traders manually draw horizontal lines to denote these levels.
An auxiliary tool exists that automatically plots these levels, clearly delineating the prospective resistance and support boundaries.

At these defined thresholds, the price action may either recoil from these areas and levels or achieve a breakout through them.
A broken resistance zone typically results in an increase in price, converting the resistance into a support level.
Should the price successfully breach a recognized support level, subsequent movement is expected to trend lower, and that broken support level will reform as a resistance point.
XAUUSD Price is where most investors think prices will rise, while hard spots show the price where many investors feel prices will drop.
Once the price has breached a support or resistance level, it is probable that the price will continue to move in that particular direction until it reaches the next support or resistance zone.
The more price tests a support or resistance line and bounces, the stronger that level gets.
Gold Technical Analysis and How to Generate Trading Signals
The trendlines approach is used to determine these values.
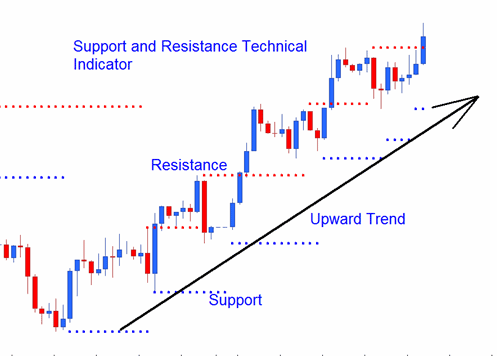
Upwards Trend
The resistance and support will typically move higher as part of an upward trend.

Upwards Trend
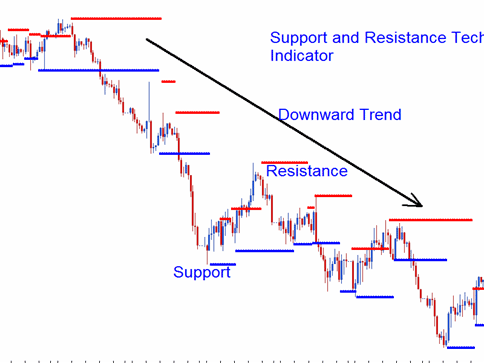
Downward Trend
In a downtrend, support and resistance levels tend to slope downward.

Downward Trend
Find More Subjects and Educations:
