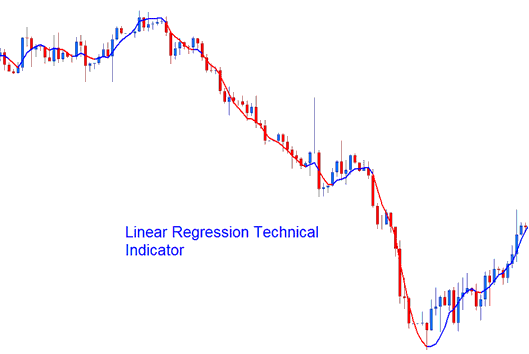
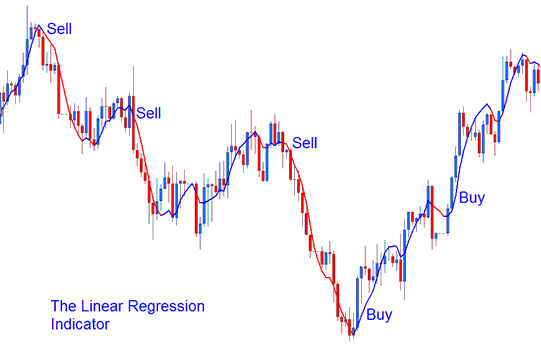
Linear Regression Analysis and Linear Regression Signals
Another name for a regression line is a line of best fit/best fit line. This indicator plots the trend of price over a specified duration of time. The trend is determined by calculating a Linear Regression Trendline using "least square fit" method. This method/technique helps to minimize distance between price data points & the line of best fit.

In contrast to the standard straight Regression Trend Line indicator, this technical analysis tool projects the endpoint values derived from several Linear Regression trend lines. Each individual point along the Linear Regression line corresponds exactly to the terminal value of one Regression Trend-Line, resulting in a resultant trendline that visually resembles a Moving Average (MA).
But unlike the Moving Average, this tool doesn't lag as much because it puts a line on the data points instead of finding the average.
Linear Regression predicts tomorrow's price today - one day ahead. If prices keep running higher or lower than the forecast, expect them to snap back to those more realistic levels pretty quickly.
In other words, this tool shows where prices "should" be based on statistics, and any big difference from the regression line will likely not last long.
Gold Analysis and How to Generate Trading Signals
This tool lets you pick a price, change the number of periods, and smooth out the price info before doing the calculation, and it lets you pick what kind of smoothing to use.
This indicator looks like a Moving Average, but it shows in two different colours.
- Bullish Signal (Blue colour) - A rising line (greater and higher than its previous value one previous bar before) is displayed & shown in the up-trend blue colour, while
- Bearish Signal (Red color) - a declining/falling line (lesser than its previous value one previous bar before) is shown & displayed in the downtrend red colour.

Technical Analysis in Gold Trading
Additional Courses and Offerings:
- How to Add Channel Indicator on MT4 Charts
- A Guide for Novice Traders on Reading and Recognizing Various Gold Chart Patterns
- EU50 Trading Strategies: Best Plans for EU50 Stock Index
- McClellan MT4 Indicator on FX
- How to Calculate AUD HKD Pip
- Momentum Market Trends Trade Parabolic Gold Price Trends
- FTSE 100 Indices
- What is the Best Way to Set Up a Chart on the MetaTrader 4 Platform?
- CADJPY Trading Session Times
