Drawing Line Charts in MT4 Software Platform
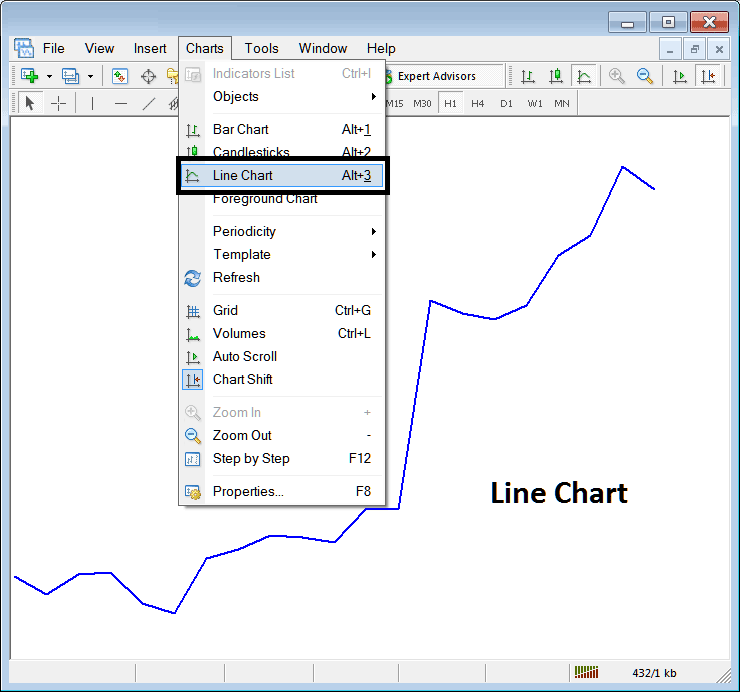
On MetaTrader 4, the fifth option in the trading chart menu is the line chart button. You'll see it illustrated below.

Many traders don't use line charts because they don't give much helpful information for analysis. This option just draws a line connecting the closing prices of a xauusd item, leaving out all other details.
Unlike candlestick charts, which display the opening, closing, lowest, and highest prices, the line chart doesn't show much information when it visually represents how the market is changing.
Much of this data proves valuable for technical analysis, with candlestick charts being particularly favored as they provide comprehensive insights for trading decisions.
For the purpose of this explanation, this charting technique is not favored by technical traders and, consequently, is not widely applied.
More Courses and Topics:
- Guide to Utilizing MT4 Demo Accounts for Forex Practice Trading
- Including Hang Seng 50 on MetaTrader 5 for PC
- Trading AEX25 Index on MT4 and MT5 Platforms
- RSI Swing Failure in Uptrends and Downtrends in Forex
- How to Add Demark Projected Range Forex Indicator on Trading Chart
- Comparing Classic Bullish Divergence with Classic Bearish Trade Divergence setups.
- How Traders Generate Buy and Sell Signals
- How to Use ROC MetaTrader 5 FX Indicator
