Ehler Laguerre RSI XAUUSD Technical Analysis & Ehlers RSI XAUUSD Signals
Developed by John Ehlers.
Originally used to trade stocks and commodities.
Ehlers RSI uses a 4-Element Laguerre filter to provide a "time distort" such that the low frequency components/ gold price spikes are delayed much more than the higher frequency components. This xauusd indicator enables much smoother filters to be created using short amounts of data.
The Ehlers RSI uses a scale of 0- 100, the center line is used to generate xauusd signals and the 80/20 levels represents overbought-oversold areas.
The only parameter which can be optimized for this technical indicator is damping gamma factor, usually 0.5 to 0.85, to best suit your trading method.
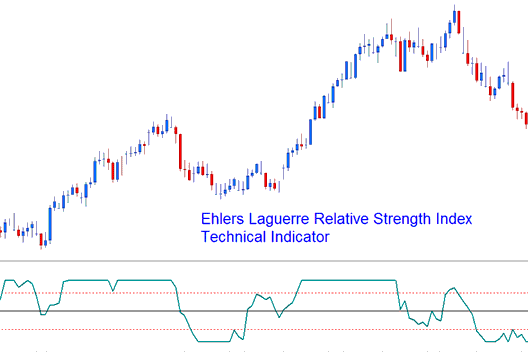
Ehlers Laguerre Relative Strength Index
Gold Technical Analysis and How to Generate Trading Signals
This implementation of the Laguerre RSI uses scale of 0-100.
Gold Trading Crossover Trading Signals
Buy Trading Signal- A buy trading signal is generated when Ehlers RSI crosses above the 50 level Mark.
Sell XAUUSD Signal- A sell trading signal is generated when the Ehlers RSI crosses below 50 level Mark.
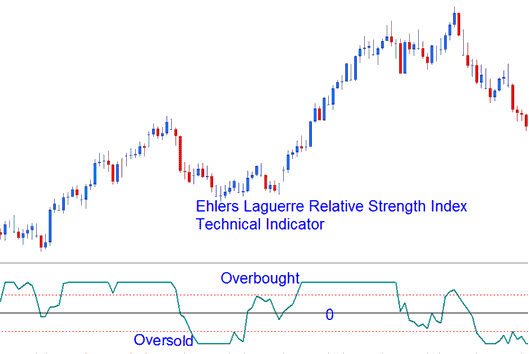
Oversold/Overbought Levels on Technical Indicator
Oversold/Overbought Levels on Indicator
A typical use of the Laguerre RSI is to buy after it crosses back above the 20% level & sell after it crosses back below the 80% level.


