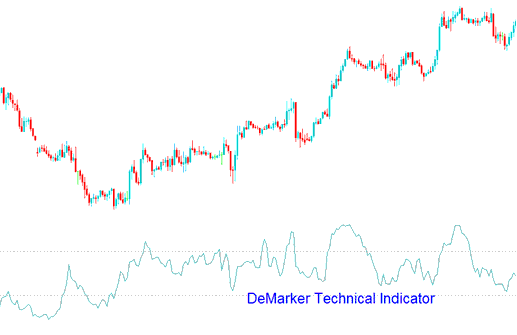
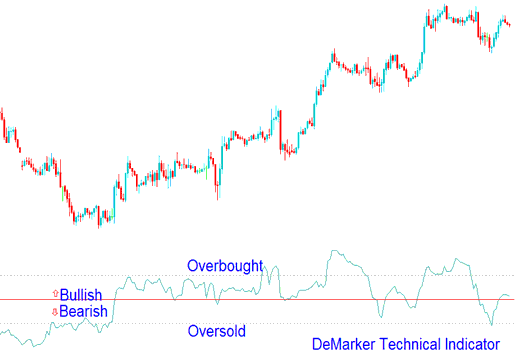
DeMarker Analysis & DeMarker Signals
Created by Tom Demark.
This indicator was engineered to address the typical weaknesses inherent in conventional overbought and oversold indicators.
Traders use the DeMarker indicator to spot possible tops and bottoms in the market by comparing price info from one bar to the next.

XAU/USD Analysis and Generating Signals
This technical tool is understood in a way that's similar to other tools that show when something is bought too much or sold too much. The overbought mark is at 70, and oversold is at 30.
Bullish Reversal Trade Signal - If the DeMarker goes under 30, you should expect the price to go up instead of down.
Bearish Reversal Trade Signal - When the DeMarker goes higher than 70, you should expect the price to go down instead of up.

Analysis in XAUUSD Trading
Utilizing longer time intervals when charting the DeMark indicator enables the capture of extended, large-scale price trends. Conversely, employing shorter time frames based on briefer periods allows for market entry at points of minimal risk, enabling precise time planning for trades structured to remain within the context of the major trend.
Study More Lessons and Topics:
- A Trading Strategy Developed for the GDAXI30 Stock Indices
- Rate of Change Indicator Analysis for Gold Trading
- Buy and Sell Signals Generated by the Chande Momentum Oscillator
- Forex Indicators Collection for MetaTrader 5
- MACD Hidden Bullish & Hidden Bearish Divergence Trading Setups
- What Happens after Bearish Reversal Chart Setup?
- Forex Support and Resistance Levels with Chart Examples
