Divergence Setups Summary - XAUUSD TRADING
Regular Bearish Difference - HH price, LH indicator - Shows that the price trend is getting weaker - Suggests the trend might change from going up to going down.
In a classic bullish divergence, prices make lower lows while the indicator makes higher lows. This signals weakness in a downtrend. It warns of a possible shift to an uptrend.
Hidden Bearish Divergence - Characterized by Lower Highs (LH) in price, yet Higher Highs (HH) on the indicator – This demonstrates the underlying strength within a trend – typically observed during corrective upward fluctuations in a prevailing bearish trend.
Hidden Bullish Divergence Setup - HL price, LL indicator - Shows strength behind a trend - Usually happens when there are decreases in an upward-moving trend.
Divergence Trading: Key Terms and Examples
M-shapes dealing with price highs
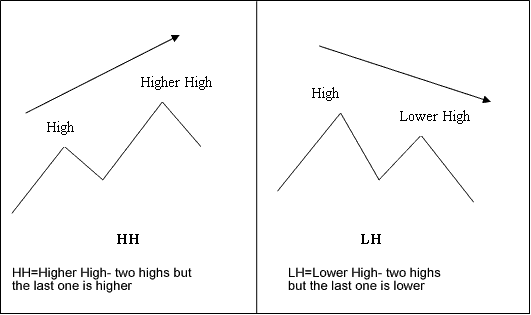
M-shapes: Divergence Trading Terms
W shapes dealing with price lows
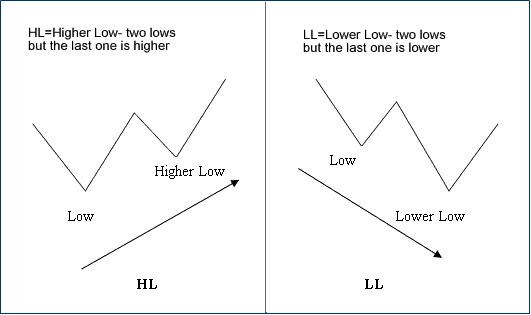
W-shapes: Divergence Trading Terms
These are the shapes to look for when using divergence trading set-ups.
One of the best indicators for using with this divergence trading setup pattern is MACD Indicator - as a divergence trading signal, MACD divergence setup is a high probability set-up to enter a position. But as with any signal there are certain parameters that have to be looked at to make this signal a high probability setup.
Starting a trade right away when you see this setup isn't the best way to go. This divergence setup should be used with another tool to be sure of the market direction of the XAUUSD price. A good system to use with this setup is the moving average MA crossover trading method.
Just so you know, setups on shorter time frames don't really carry that much weight. Spotting divergence on a 15-minute chart? It's not nearly as important as seeing it on a 4-hour or daily chart.
On timeframes such as 60 minutes, 4 hours, or daily charts, look for additional signals or elements that could indicate how prices may react to divergences and shifts.
This leads us to a critical consideration when leveraging this specific trading cue to initiate a transaction: divergence patterns observed on a higher time frame chart can frequently serve as a dependable technical signal indicating an impending shift in price direction. The crucial query then becomes: precisely WHEN? This explains why immediately entering a trade upon spotting such a divergence setup is not invariably the optimal approach.
Many people who trade get tricked into jumping in too fast when they notice the MACD isn't lining up. Often, the market still has enough force to keep going in the same general direction. The trader who entered too early can only watch sadly as the market price goes past their stop loss, causing them to lose money.
Merely searching for this divergence trading configuration without incorporating any other evaluative criteria will not optimize your probability of success. Therefore, to enhance the likelihood of achieving a winning trade, it is essential to consider peripheral factors and elements, most notably other technical indicators.
What other factors and aspects should you consider as a trader when utilizing this divergence trading setup?
Here's one trick: check support, resistance, and Fibonacci levels on higher timeframes. Looking at the bigger picture before placing a trade on a lower timeframe can really boost your chances of making a winning trade.
If your observation of the hourly, H4, or daily chart reveals that a significant resistance level, support level, or Fibonacci level has been reached, the likelihood of a successful trade initiated based on a divergence signal on a lower timeframe is enhanced at that juncture.
2. Reward-to-Risk Ratio: Lastly, when identifying divergence trading setups, it is critically important for the trader to execute the entry precisely to secure a favorable risk-to-reward ratio. Only those trades presenting greater potential profit than the capital being risked should be considered. By mastering correct position entry techniques, a Gold trader can pre-calculate the risk-to-reward ratio before committing capital, ensuring that only trades offering an advantageous ratio are selected for execution.
Used right with other indicators to check signals, divergence patterns make a solid way to trade gold.
More Topics:
- How to Add Bollinger Percent B Indicator on a Chart on Platform
- Bollinger Band MT5 Trading Analysis in Forex
- What is the Pip Size for NZDSGD?
- Study To Trade Online XAUUSD Market Guide
- How Do I Trade NASDAQ100 Index for New People?
- Best Time to Trade EURUSD in GMT
- Finding classic bullish divergence setups and classic bearish divergence setups
- How to Setup the RSI Tool on a Chart?
- Practicing with an MT4 Forex Demo Account
- When's the best time to trade EUR/PLN in EST?