How to Set RSI on MetaTrader 4 Charts - Adding MT4 RSI Chart Indicator
Step 1: Open Navigator Panel Window on Software Platform
Open the Navigator window like is shown & displayed below: Navigate to 'View' menu (press on it), then select 'Navigator' window (press), or From Standard ToolBar click 'Navigator' button or press key board short-cut keys 'Ctrl+N'
On Navigator window, choose and select 'Indicators', (Double Press)
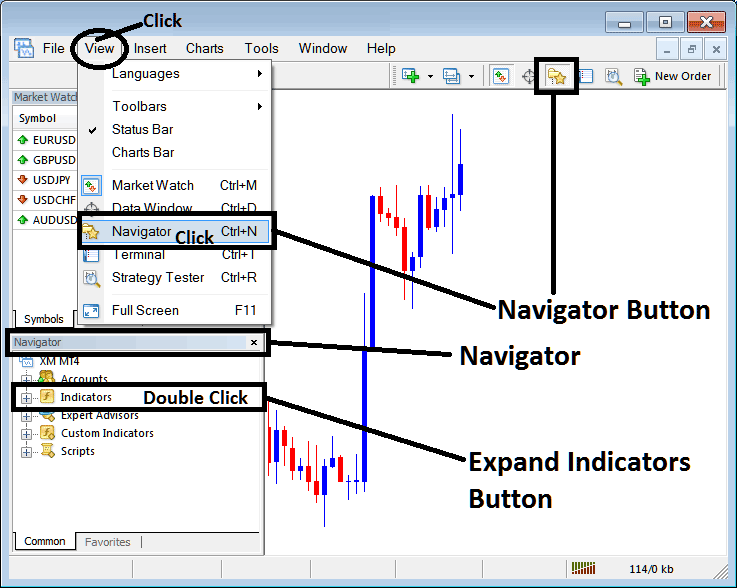
How Do You Add RSI on MT4 Platform - MT4 RSI Indicator
Step 2: Expand the Indicators Menu on the Navigator - Adding RSI MT4 Chart Indicator
Expand this menu by clicking the unfold tool/button impress mark + or double-click the 'indicators' menu, afterwards the button will appear and be shown as (-) & will now display a list just as shown below - select and choose the RSI chart indicator from this list of trading indicators so as to add the RSI on the forex chart.
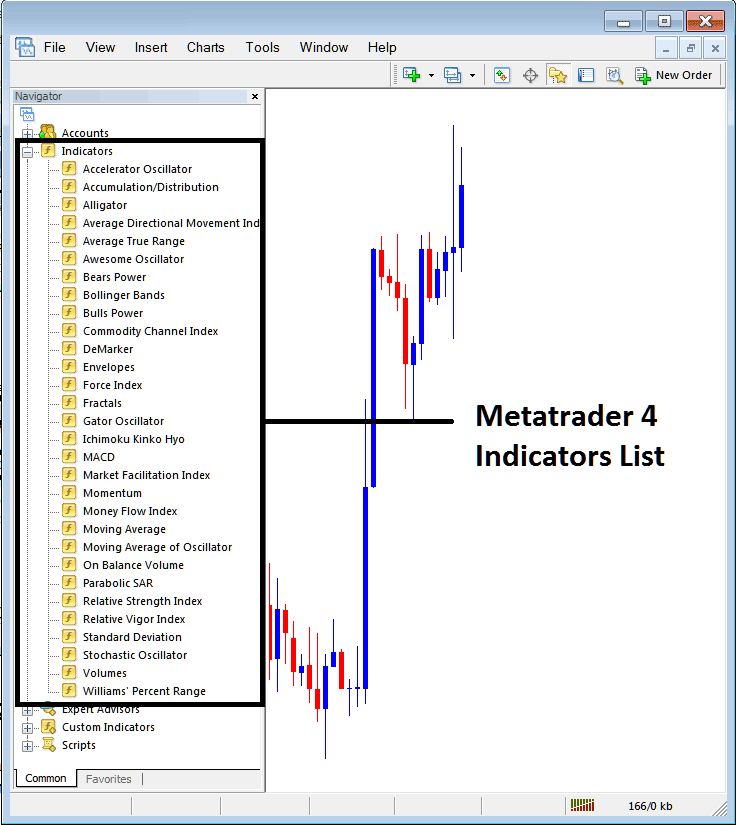
How Do You Add RSI - From the Above window you can then place RSI that you want on the chart
How to Set Custom RSI to MT4
If the indicator you want to add is a custom technical technical indicator - for example if the RSI you want to add is a custom indicator you will need to first add this custom RSI on the MetaTrader 4 software and then compile the custom RSI so that as the newly added RSI custom indicator pops up on the list of the custom indicators in MetaTrader 4 software.
To learn how to setup RSI indicators on MT4, how to add RSI panel to MT4 and how to add RSI custom indicator in the MT4 - How to add a custom RSI on MT4 Platform.
About RSI Example Explained
Relative Strength Index RSI Technical Analysis & RSI Signals
Developed & Created by J. Welles Wilder, presented in the book "New Concepts in Technical Trading Strategies".
Relative Strength Index is the most popular/liked indicator & it is a momentum oscillator & a trend following technical indicator. RSI compares a currency magnitude of the recent price gains against its magnitude of recent losses price losses & draws this data on a scale of values that ranges between 0-100.
Relative Strength Index measures the energy of a currency pair: readings above 50 signal bullish momentum while values/readings below 50 center-line signify bearish energy.
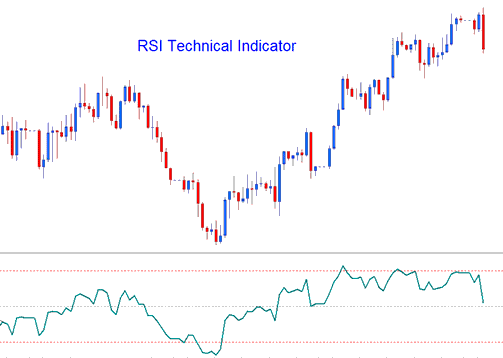
- RSI is drawn as a green line
- Horizontal dashed lines are plotted & drawn to identifying overbought and oversold levels are - 70/30 levels respectively.
Forex Technical Analysis and How to Generate Signals
There are various methods/techniques used to trade, these are:
50-level Cross-over Signals
- Buy trade signal - when the indicator crosses above 50 mark a buy/bullish trade signal is given/generated.
- Sell Signal - when the trading indicator crosses below the 50 mark a sell/bearish signal is given/generated.
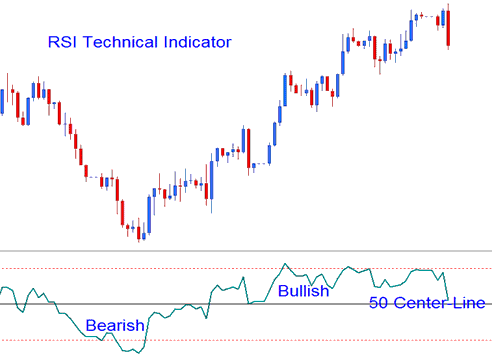
RSI Patterns
Traders can draw trend lines & map out patterns on the RSI. The RSI often forms chart patterns like head and shoulders pattern which might & may not have formed & shaped clearly on the price chart.
Forex Support/Resistance Break Outs
RSI is a leading indicator & can be used to predict the Support and Resistance Break Outs before price breaks its support/resistance level. RSI indicator uses the swing failure signal to predict when price is about to break support and resistance zones.
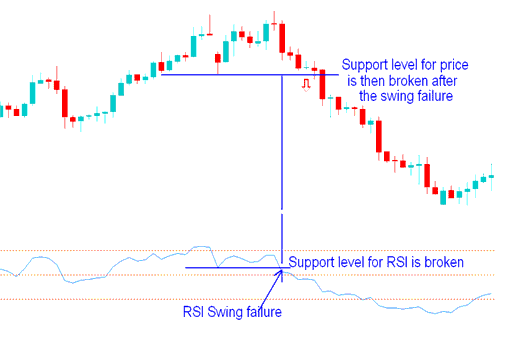
Swing Failure - Support and Resistance Break-out
Over-bought/Oversold Conditions in Indicator
- Overbought levels above 80
- Over-sold - levels below 20
These levels can be used to generate FX signals like when RSI turns upward from below 20 after oversold, buy & sell when the RSI crosses to below 80 after overbought, sell. These signals are not suitable for trading Forex because they are prone to a lot of fake outs.
Divergence Forex Trade Setups
Divergence trading is one of the analysis method/technique used to trade reversals of the price trends. There are four types of divergences which can be traded and transacted with this technical indicator covered & discussed on the divergence course on this website.
Learn More Tutorials & Lessons:
- Insert Shapes in MT4 Forex Charts
- Reasons Traders Choose STP Brokers
- Selecting & Picking the Top FX Program to Learn From
- Linear Regression Slope Analysis
- Which are the Most Liquid Forex Pairs in?
- How to Interpret/Analyze FX Market Moves Explained
- How to Add MACD Indicators to XAU/USD Charts on MT4
- Forex Choppiness Index – Expert Advisor Setup
- Lessons in XAUUSD Trading
- Information on Regulated Brokers

