Continuation Patterns XAUUSD Trading Patterns
Once these particular chart patterns suggesting continuation materialize on the trading visualization, they validate that the prevailing price tendency for Gold is set to maintain its existing trajectory.
Gold traders use these continuation chart patterns to find the midpoints of a market trend: this is because these patterns form at the trend's halfway point.
The four kinds of continuation chart patterns are:
- Ascending triangle
- Descending triangle
- Bull flag/pennant
- Bear flag/pennant
Rising Triangle Continuation Pattern
The ascending triangle chart formation materializes during an existing uptrend and signals an expectation for the price's upward momentum to persist. It illustrates a price ceiling (resistance zone) where buyers (bulls) repeatedly exert upward pressure, and a breakthrough of this ceiling typically confirms the market will continue ascending.
The resistance above temporarily stops the gold market from going higher, but the rising trend line below the pattern shows that buyers are still interested. If the upper trend line is broken, it's a technical signal to buy, as the market is breaking out of a rising triangle. This pattern is found when gold prices are generally going up, and the rising triangle appears as a pause in the upward trend, suggesting the upward trend will continue.
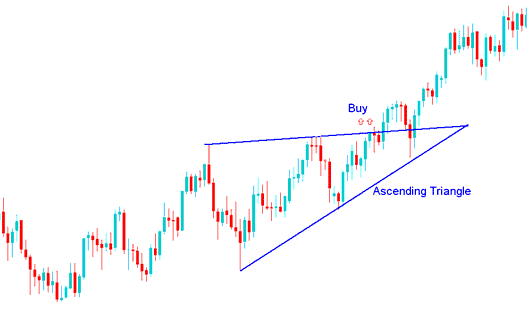
Rising Triangle as a Continuation Pattern
The market formed an ascending triangle during its uptrend, which led to a breakout to the upside. The buy signal comes when the price breaks above the upper slanting line and keeps moving higher.
Falling Triangle Pattern
A descending triangle forms during a downtrend. It signals the market will keep falling. Sellers push against a support area each time. They force it lower. When that support breaks, prices drop further.
The support area stops the market from decreasing for a short time, but the line sloping down above the pattern shows that sellers are still involved. A break down through the bottom line is a signal to sell, showing the market is breaking down from a descending triangle chart, meaning selling is likely to continue.
Found within a Gold price downtrend, the descending triangle develops/forms as a consolidation period within the downtrend & reflects down-side continuation will follow.
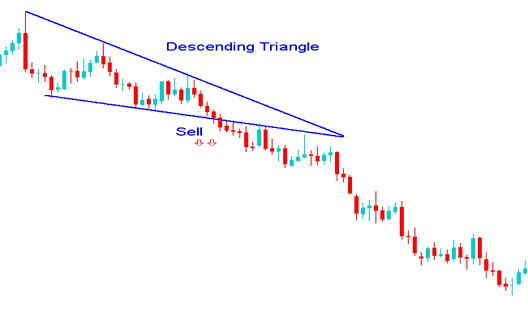
Falling Triangle Continuation Setup
The market made a descending triangle during its downtrend, which led to more selling and the trend continued downwards. The sell signal happens when the price goes below the lower horizontal line as selling continues to push the market lower.
Bull Pennant/Flag
This setup that continues the trend forms something that looks like a rectangle. The rectangle is formed by 2 lines next to each other that act as support and resistance until the price moves outside it. Usually, the flag won't be fully flat, but slanted.
The bull flag is found within a Gold price upward trend. In this continuation chart pattern the market price retraces slightly and this pattern can be considered as a slight retracement with narrow price action that has a small downwards tilt. The buy point is when price penetrates upper line of flag. The flag portion has highs and lows which can be linked by small lines that are parallel, giving it look of a small channel.
The pennant pattern appears at the midpoint of a bullish upward trend, and following a breakout, a movement equivalent to the height of the flagpole is anticipated.
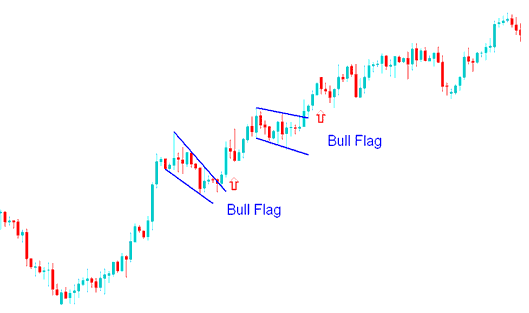
Bull Flag Pennant Continuation Setup
The bull pennant continuation chart pattern illustrated above was merely a period of consolidation as the market built strength to break out and ascend. The continuation trade signal was confirmed when the upper line was breached to the upside.
Bear Flag/Pennant Setup
This bear flag formation manifests within a prevailing downward trend for Gold prices. The bear flag is a continuation pattern where the price experiences a minor retracement characterized by tightly confined price action exhibiting a slight upward slant. The optimal point to sell is triggered when the price breaks below the lower boundary line of this inverted flag. The pennant segment features peaks and troughs that can be connected by lines that are nearly parallel, creating the appearance of a confined channel.
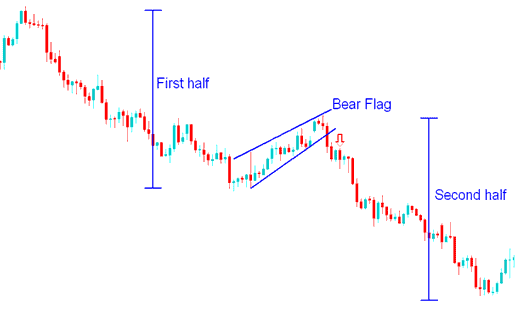
Bear Flag Pennant Setup
The bear flag pennant pattern paused the market before more drops. The signal confirmed when price broke the lower line downward.
Get More Lessons:
- What Gold Traders Should Know Before Trading Gold
- Check out the Keltner Bands Automated Forex Trading EA.
- Trade Double Tops & Double Bottoms Stock Indices Strategy with Bollinger Bands Trend Reversal Setups
- Figure Out the Worth/Size of 1 Pip for S& PASX 200 Indices
- FTSE 100 Indices
- Fundamental Guidelines for an FX System: Generating Buy and Sell Signals
- Where is JP 225 on MT5 Platform/Software?