What Happens To Commodity Trading Price Action After a Reverse Head & Shoulders Chart Pattern?
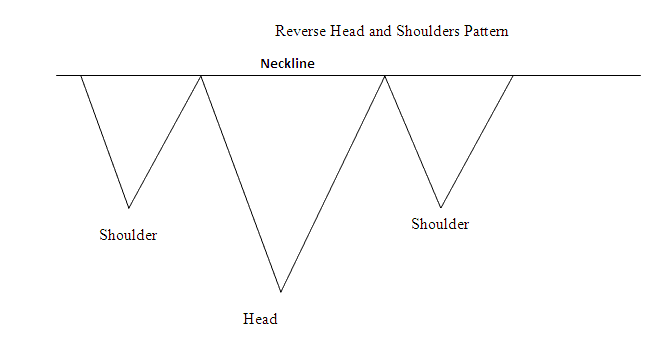
Inverse Head & shoulders Commodities Trading Pattern
Inverse Head & Shoulders Chart Pattern is a reversal head and shoulders chart pattern that is formed after an extended Commodity Trading downwards trend. It resembles an upside-down head shoulders.
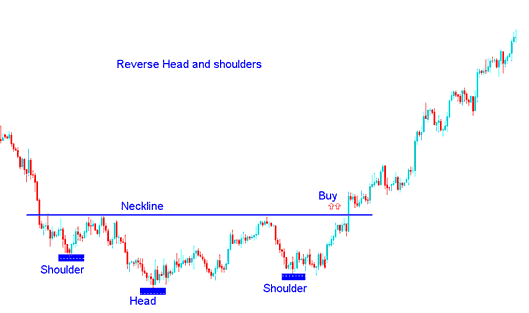
Inverse Head & Shoulders Pattern is considered complete once commodity price penetrates above the neck line, which is drawn by joining these two peaks between the reverse shoulders pattern.
Traders open buy commodities trades using this reversal trading signal once the commodity price closes above the neckline.
Summary:
- Inverse Head and Shoulders Pattern forms after an extended move downward
- Inverse Head & Shoulders Pattern indicates that there will be a reversal in commodities trading market
- Inverse Head & Shoulders Pattern formation resembles upside down, thus its name Inverse Head and Shoulders Chart Pattern.
- We buy when price breaks-out above neck line: as described on the commodities trading example shown below.
What Happens To Commodity Trading Price Action After a Reverse Head and Shoulders Pattern?
Examples of Inverse Head and Shoulders Chart Pattern on a Commodity Trading Chart
How to Analyze the Inverse Head and Shoulders Chart Pattern