What Commodity Trading Chart Should I Trade With?
The most popular commodity charts in the Commodity Market are : Line charts, Bar charts & Candlestick charts.
As a beginner wanting to know which commodity chart you should trade with the advantages of the Candlesticks charts are explained below - which makes the candlesticks charts the best choice of commodity trading with.
The commodity candlesticks are easy to use as compared to line charts or bar charts.
How to Read Commodity Candles Charts
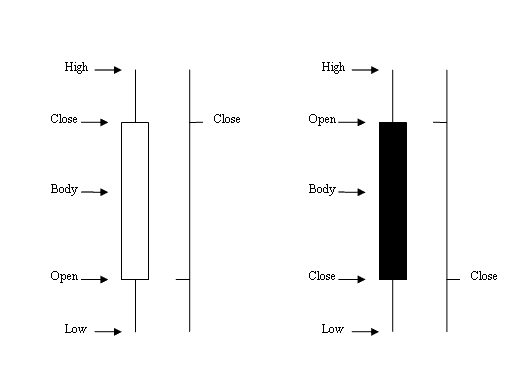
Commodity Trading Candlesticks Charts - these commodity candlesticks charts use the same price data as bar charts (open, high, low, and close). However, these commodity candlestick charts are represented in a much more visually identifiable way which resembles a candle with wicks on both sides.
How to Interpret Commodity Candles Charts
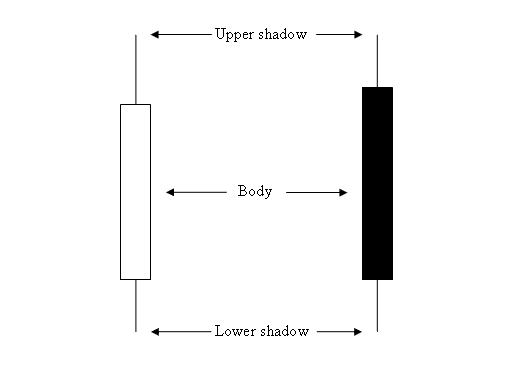
Rectangle part of the candle is known as body.
The high & low of the candle stick are described as shadows and plotted as poking lines.
How to Read Commodity Trading Candle Charts for Beginner Traders Tutorial
The color of the commodity trading candle-stick is either blue or red:
- (Blue or Green Color Commodity Candles) - Commodity Trading Prices moved up
- (Red Color Commodity Candles) - Commodity Trading Prices moved down
Most commodity trading platforms like the MT4 Commodities Trading Software, use colors to mark the direction of the commodity price represented using the commodities trading candlestick. Commodity Trading Candlesticks colors used are blue or green colors; when price moves up, color of commodity candle is blue: when price moves downward, color of commodity candlestick is red.
How to Read Commodity Candlesticks Charts for Beginners
When Commodity Trading candle sticks charts are used it's very easy to see if the commodity price moved up or down as opposed to when bar charts are used.