Is a Double Tops Chart Pattern Bullish or Bearish?
A double top chart pattern has an M shape and it occurs at a market top hence its name double top chart pattern and it signals a bearish commodity price reversal in the commodities trading market.
Once a double top chart pattern is confirmed then the commodities trading market will be considered to be bearish, therefore a double top is bearish.
Double Top Trading Pattern
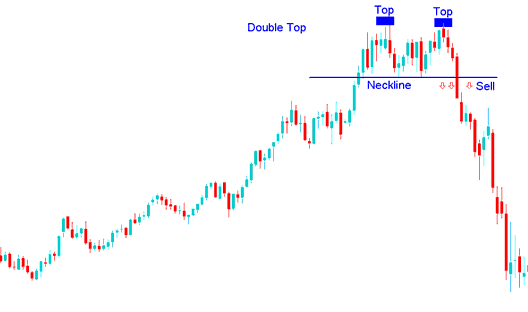
Double tops commodities pattern is a reversal chart pattern that is formed after an extended upward commodities trend. As its name implies, this double top chart pattern formation is made up of 2 consecutive peaks that are roughly equal, with a moderate trough between.
This double tops pattern formation is considered complete once commodity price makes second peak & then penetrates the lowest point between the highs, called the neckline. The sell signal from this double top pattern formation occurs when the commodities trading market breaks below neck-line.
In Commodity Trading, this double top pattern formation is used as a early warning signal that a bullish Commodity Trading trend is about to reverse. However, double top pattern is only confirmed once the neck line is broken & the commodities trading market moves below the neck-line. Neckline is just another name for the last support level formed on the Commodity Trading chart.
Summary:
- Double tops commodity trading pattern forms after an extended move upward
- This double top pattern formation indicates that there will be a reversal in commodities trading market
- We sell when price breaks out below the neckline: see below for explanation.
Is a Double Tops Chart Pattern Bullish or Bearish?