Commodity Trading Read Double Tops Trading Pattern
Commodities Trade Double Tops Chart Pattern
To interpret the double tops chart pattern a trader will need to learn about the double tops pattern technical analysis explained below.
Commodity Trading Interpret Double Tops Chart Pattern
Double tops commodities pattern is a reversal chart pattern which forms after an extended upward commodities trend.
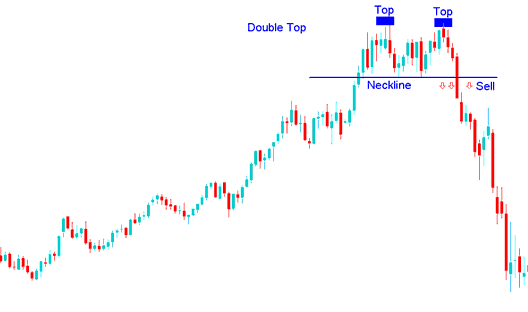
This double tops chart pattern formation is made up of two consecutive peaks that form on the commodity chart and these two commodity peaks are roughly equal - with a moderate trough in between the two commodity trading price peaks.
Double tops commodities chart pattern is considered to be complete once commodity trading price makes second peak & then penetrates lowest commodity trading price point between the two commodity trading price highs - this lowest point between the two commodity trading price peaks is called the neckline.
Sell commodity trading signal from the double tops chart pattern is generated when the price breaks below the neckline.
In commodity trading double tops chart pattern is used as a early warning signal that an upward commodity trend is about to reverse.
However, the double tops chart pattern is confirmed once the commodity trading price moves below the neckline - when the commodity neckline is broken the commodity trading price will move below the neckline.
Neck Line is just another name for the last support level formed on the commodities trading chart.
Summary: Commodity Trading Interpret Double Tops Chart Pattern?
- Double tops commodities chart pattern forms after an extended upwards commodity trend move
- Double tops commodities chart pattern signals that there will be a reversal in the upward trend direction
- Commodity traders will sell when price breaks-out below neck-line: as explained on the double tops chart pattern example shown below.
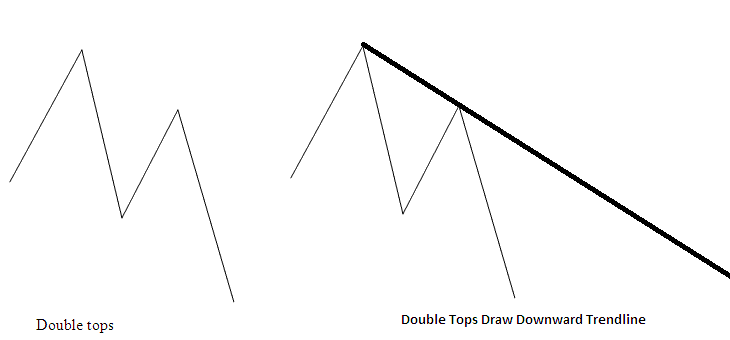
Double tops commodities pattern look like an M Shape pattern - the best double top chart pattern reversal commodities trading setup is where the second top is lower than the first top as shown on the commodity double tops chart pattern below:
This means that the reversal commodity signal can be confirmed by drawing a downward commodity trend line as shown on the commodities trading example shown below. If a trader opens a sell commodity trade using this double tops chart pattern reversal commodity signal the commodity trading stop loss order will be placed just above this downwards trend line.
Commodity Trading Interpret Double Tops Chart Pattern
Interpret Double Tops Chart Pattern