Commodity Trading Charts Technical Analysis
To analyze commodity charts traders should learn the two technical analysis used to interpret commodity price movement on commodity charts. These two technical analysis are:
Japanese Candles Charts Analysis
Commodity Trading Chart Patterns Analysis
- Japanese Commodity Candle sticks - Study of a single candlestick - Japanese Candlesticks Technical Analysis
- Commodity Patterns - Study of a sequence of candles formations in commodity trading
The different topics for these two types of commodity technical analysis are:
Learn Japanese Commodity Trading Candlesticks Technical Analysis Tutorials
Commodity Trading Chart Patterns Technical Analysis Tutorials
The commodity chart example below also illustrate the difference of the formations of these two technical analysis methods.
Candle Sticks Charts - Study of a single candle-stick technical analysis
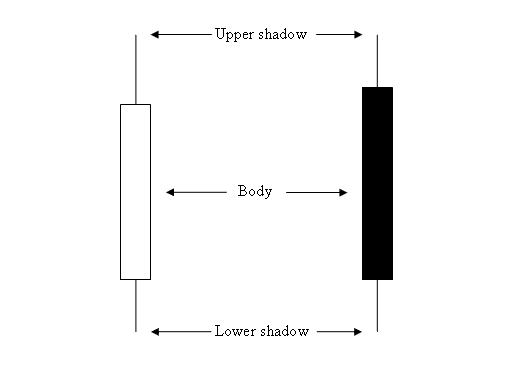
Commodity Candlesticks Charts - Study of a single candle technical analysis
Commodity Trading Chart Patterns - Study of a sequence of candle sticks technical analysis
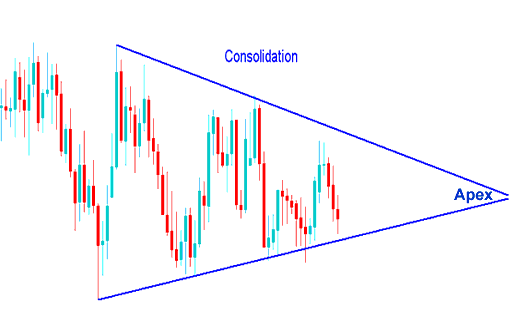
Commodity Trading Chart Patterns - Study of a sequence of candle sticks technical analysis