Three Common CFDs Chart Patterns
Cfd chart patterns is the study of repeating cfd chart patterns that are commonly used to trade the cfds trading market. This cfd chart patterns Tutorial helps cfd traders learn how to read these cfd patterns & how to interpret the trading signals given by these cfd trading chart patterns.
Learn CFDs Chart Pattern PDF
The Three common cfd chart patterns are:
1. Reversal Chart Patterns
- Double Top Patterns
- Double Bottom Chart Patterns
- Head and Shoulders Patterns
- Reverse Head & Shoulders Patterns
Reversal Chart Patterns Described Tutorials
Double Tops Patterns & Double Bottom Chart Patterns
Head & shoulders CFDs Patterns and Reverse Head & shoulders CFDs Chart Patterns
Reversal Chart Patterns confirm the reversal of the cfd market cfd trend once this reversal chart patterns setup is confirmed. These reversal chart patterns are formed after extended market cfd trend either upward or downwards & these patterns trading signal that the cfd market cfd trend is ready to reverse.
2. Continuation Chart Patterns
- Ascending Triangle Patterns
- Descending Triangle Patterns
- Bull Flag/Pennant Chart Patterns
- Bear Flag/Pennant Patterns
Continuation Patterns Described Guides
Continuation Chart Patterns are arrangements that set up the cfd market for a cfd trend continuation move in direction of the prior CFD trend. These continuation patterns are formed when the CFD market is taking a break before continuing in same direction of the previous CFD trend.
3. Bilateral CFD Trading Patterns
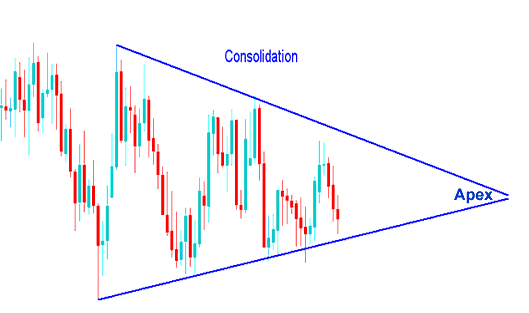
- Symmetric Triangle - Consolidation Patterns
- Rectangle - Range CFDs Chart Patterns
Consolidation Patterns Described Guides
Consolidation Patterns form when the cfd market is taking a break before deciding the next direction to take. When these consolidation patterns are formed the cfd market is trying to decide what direction to trade.
What's CFDs Chart Patterns in CFD?
CFDs Chart Patterns - Study of a candlesticks cfd trading patterns
CFDs Patterns - What is CFDs Chart Patterns in CFD?


