CFD Price Breakout after Double Bottoms Pattern
Double bottoms cfd pattern is a reversal chart pattern that is formed after an extended downward cfds trend.
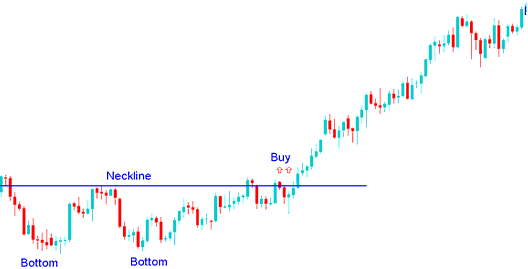
Double bottoms cfd pattern is made up of two consecutive troughs that are roughly equal, with a moderate peak that is in between the two troughs.
The buy signal from this double bottoms chart pattern market bottoming out cfd signal occurs when the cfd market breaks-out the neckline to the upside.
In CFD, the double bottom pattern is an early warning cfd signal that the bearish cfds trend is about to reverse.
Double Bottom Pattern is only considered complete/confirmed once the neck-line is broken.
In this double bottoms chart patterns formation the neckline is the resistance level for the cfd price. Once this resistance is broken the cfd market will move up.
Summary:
- Double bottoms cfd pattern forms after an extended move downward - cfd trading downwards trend
- This Double bottoms cfd chart pattern formation indicates that there will be a reversal in the cfd trading market
- We buy when price breaks-out above neck line: as described on the cfd examples explained & illustrated below.
What Happens To CFD Price Action After a Double Bottoms Chart Pattern in CFD?
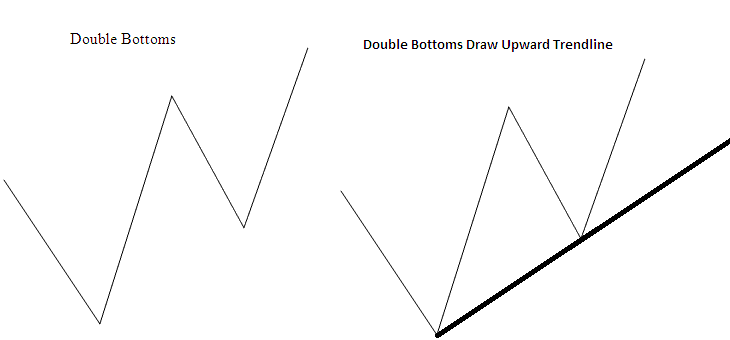
The double bottom pattern look like a W Shape cfd chart pattern, the best reversal cfds trading signal is where second bottom is higher than the first bottom as illustrated below.
This means that the reversal cfd trading signal from the double bottom pattern can be confirmed by drawing an upwards cfd trend line as shown below. If a trader opens a buy trading signal the stop loss will be placed just below this upwards trend line.
What Happens To CFD Price Action After a Double Bottoms Chart Pattern in CFD


