How Do You Analyze Head and Shoulders Chart Pattern Technical Analysis?
A Head and Shoulders chart pattern is a bearish trend reversal trading signal that trading signals the current upward cfd price trend is about to reverse once the Head and Shoulders cfd trading pattern is confirmed.
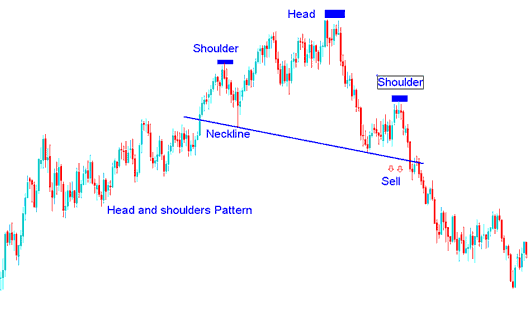
The Head and Shoulders chart pattern is a pattern with three consecutive highs where the second high is slightly higher than the first and third high which signals upwards trend is losing momentum & if the cfd price of the cfd falls below the support zone which is the 2 lows between the 3 highs then the Head and Shoulders pattern is considered to be confirmed and the cfd price of the cfd changes to a bearish trend.
How Do I Interpret Head and Shoulders Chart Pattern Technical Analysis?


