How Do You Interpret Double Tops Chart Pattern Technical Analysis?
A double tops chart pattern is a bearish trend reversal trading signal which trading signals the current upward cfd market is about to reverse once the double tops trading pattern is confirmed.
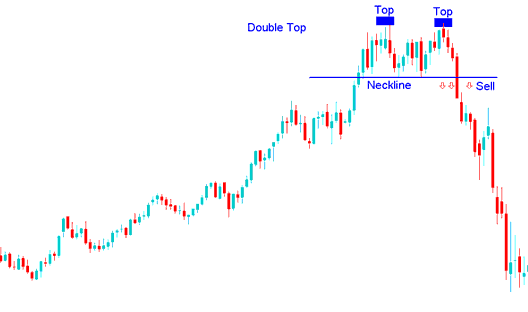
The double top chart pattern is a pattern with two consecutive peaks where second peak is slightly lower than first peak which signals the upward trend is losing momentum & if the cfd price of the cfd falls below the support level which is the low between the 2 peaks then double tops pattern is considered to be confirmed & the cfd price of the cfd changes to a bearish trend.
How Do You Analyze Double Tops Chart Pattern Technical Analysis?


