Ultimate Oscillator Bitcoin Analysis & Ultimate Oscillator Trading Signals
Originally developed and used to trade stocks and commodities markets.
This oscillator aims at striking a balance between leading signals & lagging signals given by the common indicators.
- Leading - some indicators lead the btcusd trading market and give signals earlier than the optimum time
- Lagging - some indicators lag the btcusd trading market so far that half of the move is over before a signal is generated.
This is the balance that the oscillator aims to strike, not to lead too much or lag too much - this way the oscillator will always give a signal at the ultimate time, thus its name.
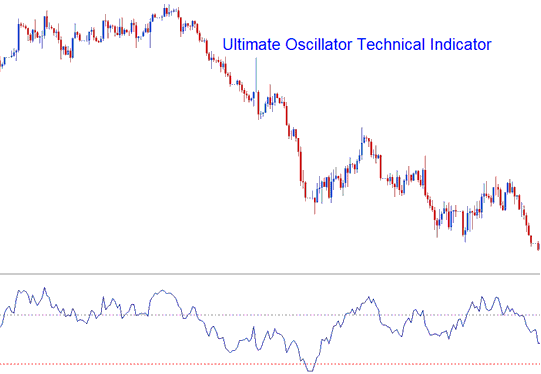
This btcusd indicator uses 3 different n-number of candlesticks and calculates the combined weighted sums of bitcoin price action from these candlesticks and plots these values a scale ranging from 0 to 100. Values of above 70 are considered to be overbought levels while values of below 30 are considered to be oversold levels.
The time periods used to calculate the ultimate oscillator are 7 periods (short term trend), 14 periods (intermediate term trend) & 28 periods (long term trend).
Bitcoin Analysis & Generating Trading Signals
This Bitcoin technical indicator can be used in generating buy & sell cryptocurrency signals using various methods.
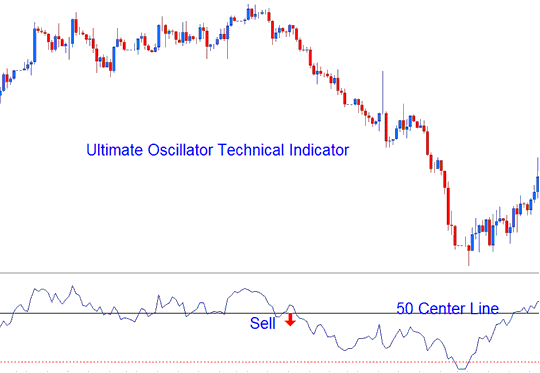
Center line Bitcoin Trading Crossover Trading Signal
Buy Bitcoin Signal - values above 50 center line level
Sell Bitcoin Signal - values below 50 center line level
Center line Bitcoin Trading Crossover Trading Signal
Overbought/Oversold Levels on Technical Indicator
Overbought - levels above 70 - sell bitcoin trading signal
Oversold - levels below 30 - buy bitcoin trading signal
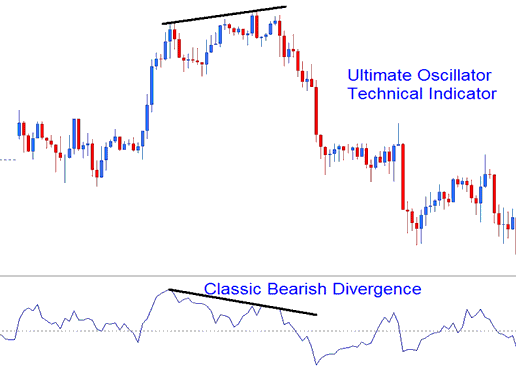
Divergence BTCUSD Trading
The oscillator can also be used to trade divergence cryptocurrency signals, below is an example of a classic bearish divergence signal.
Technical Analysis