Short Term Bitcoin Trading with Moving Averages
Moving Averages Bitcoin Trading Systems Strategies
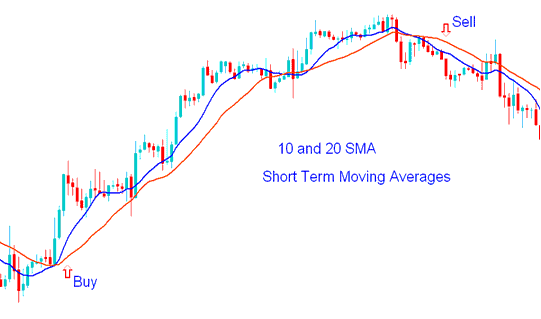
Short-term trading will utilize brief bitcoin price periods, such as the 10 and 20 MA periods.
In the presented cryptocurrency scenario, we utilize a 10-period and a 20-period Simple Moving Average to generate actionable Bitcoin signals. These signals are instrumental in identifying the early direction of the current Bitcoin trend.

Short-Term Trading with Moving Averages - An Example of Trading Utilizing Moving Averages
Scalper Bitcoin Trader
One of the most frequently employed analytical techniques for deciphering cryptocurrency chart trends in a scalping context involves the application of the Moving Average (MA) indicator.
The idea behind this MA cryptocurrency indicator is to simply enhance technical analysis before taking a cryptocurrency signal to enter the btcusd market. Planning and setting bitcoin goals in the short term according to moving averages helps a scalper bitcoin trader to identify trends in the btcusd market and thus open a bitcoin order accordingly.
Many crypto signals build on a set Bitcoin price span for the Moving Average tool. BTCUSD moving averages guide if you trade short or long term. Plus, if price sits above or below this average, it sets the day's Bitcoin trend in the BTCUSD market.
If a significant portion of the bitcoin market price is seen as being below the Moving average trading indicator, then the overall bitcoin trend for that day is going downward. Most bitcoin traders use the Moving Average as a point of support or resistance to determine when to start a bitcoin position: if the bitcoin price touches or tests the Moving Average(MA) Technical Indicator in the direction of the market trend, then a bitcoin trade is started.
Bitcoin moving averages connect with price action to spot good entry and exit points in BTC/USD. The market always swings around. Prices bounce off these averages often. Traders use that to create buy or sell signals.
Simple moving averages are figured out by watching the bitcoin price over a set amount of time, using enough information to do the math. Many bitcoin trading scalpers have gotten helpful advice from how these averages are understood, telling them how and when to start a bitcoin scalping trade.
Medium Term Strategy
A medium-term bitcoin trading strategy will utilize the 50-period Moving Average.
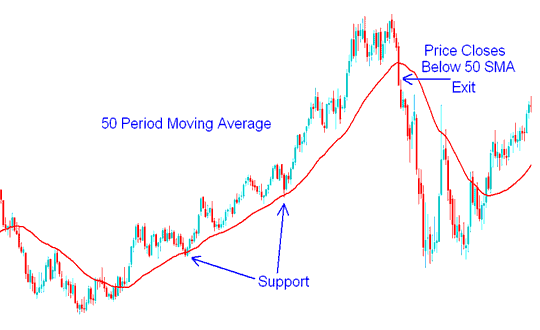
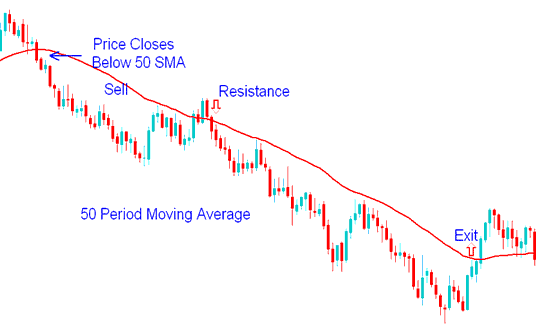
The Moving Average calculated over 50 periods (MA) functions as either a floor (support) or a ceiling (resistance) level for Bitcoin's valuation.
During an uptrend for Bitcoin, the 50-period Moving Average functions as a support level: the BTC price is expected to consistently rebound upwards after contacting this MA. A closing price below this indicator serves as an exit confirmation.

50 Moving Average Period Support - Bitcoin Strategy Method Example
When bitcoin is going down, the 50 period Moving Average will act like a barrier, and the bitcoin price should usually go down after touching it. If the btcusd market closes above the indicator, that means it's time to sell.

50 Moving Average(MA) Period Resistance - Bitcoin Strategies Example
50 Day Moving Average Bitcoin Analysis
As the bitcoin trend moves up, there's a key line you want to watch - this is the 50 day bitcoin trading Moving Average. If the btcusd market stays above this 50 day bitcoin trading moving average, that is a good trading signal. If the bitcoin market drops below the 50 day trading moving average in heavy volume, watch out, there could be bitcoin trend reversal crypto signal ahead.
A 50 day Moving Average cryptocurrency indicator takes 10 weeks of market data, & then plots/draws the average. Moving line is re-calculated everyday. This will show the bitcoin trend - it can be upward, downward, or sideways.
Typically, one should only purchase when btcusd prices exceed their 50-day bitcoin trading Moving Average. This indicates that the prevailing market trend is moving upwards. It is advisable to trade in alignment with the bitcoin trend rather than against it. Numerous bitcoin traders exclusively open orders in the direction of the cryptocurrency trend.
Bitcoin prices often hit support at the 50-day moving average. Big investment firms watch this level closely. When they see a downtrend reaching it, they view it as a chance to add to positions or start new ones at a fair price.
What happens if Bitcoin's price falls and cuts through its 50-day line? On huge volume, it sends a clear sell signal for crypto. Big institutions are dumping their holdings. This can spark a sharp drop, even if basics seem strong. But if Bitcoin dips just under the 50-day line on low volume, keep an eye on it. Watch its moves over the next days. Act if you need to.
LongTerm Strategy
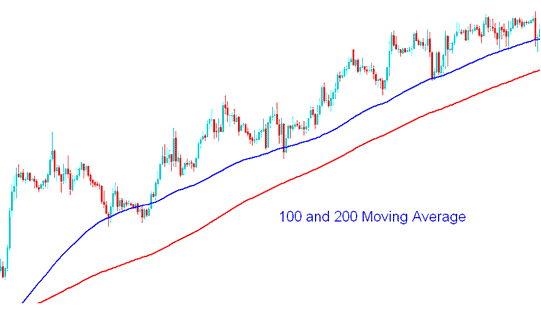
A bitcoin plan for the long run will look at things like the 100 & 200 MAs, which often act like spots where the price finds support or meets resistance over time. Because lots of bitcoin investors watch the 100 and 200 btcusd moving averages, the price often changes direction around these levels.

Utilizing 100- and 200-Period Moving Averages - Strategies for Bitcoin Trading Incorporating MA Crossover Techniques.
In BTCUSD, traders may employ both fundamental and technical analysis to ascertain whether bitcoin represents a favorable buy or sell opportunity.
When examining cryptocurrency using technical analysis, bitcoin traders often look at the 200-day moving average to understand bitcoin supply and demand in different ways.
Traders are generally most accustomed to the basic cryptocurrency market analysis provided by the 200-day Moving Average, which is frequently employed to define the long-term parameters for support and resistance. A bitcoin price situated above this 200-day Moving Average indicates a bullish bitcoin trend, whereas a price positioned beneath it signals a bearish trajectory.
One technique for gauging supply and demand dynamics in Bitcoin trading involves averaging the closing BTCCUSD price across the preceding 200 trading sessions. This 200-day MA incorporates historical data from each prior day, illustrating the trajectory of this 200-day average value.
The explanation why the average 200 day Moving Average in particular is so popular in cryptocurrency trading analysis is because historically has been used and it produces good results for trading in the btcusd market. A popular timing bitcoin strategy is used to buy when the btcusd market is above its moving average of 200 days & sell when it goes below it.
This tool that uses moving averages gives crypto traders alerts. It signals when the Bitcoin price goes above or below its 200-day average. Use technical analysis to decide on long or short trades.
Study More Topics and Tutorials:
- BTC/USD Uptrend: Trendline Crossover and Reversal Strategy
- Trading Bitcoin on MetaTrader 5: Using the Android App
- A Guide to Testing MQ5 Automated BTC USD Trading Robots (Expert Advisors)
- Hidden Divergence Trading System: Comprehensive Tutorial Guide
- How do you trade Bitcoin with a BTC/USD trend reversal strategy?
- Bitcoin Trading via Mobile App for Enhanced Convenience
- How do you spot a trend reversal on trading charts?
- Decoding and Interpreting the BTC/USD Symbol Within MetaTrader 4 Software
- How Can You Trade Bitcoin & Set SL BTC/USD Order in MT5 Platform/Software?
- Ways to Save a MT4 Charts Profile on MT4 Trading Program
