Momentum Bitcoin Analysis & Momentum Oscillator Signals
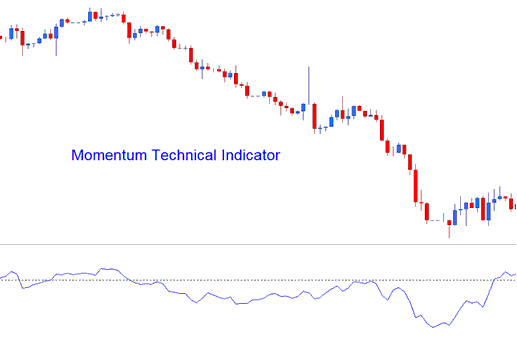
Momentum technical indicator uses mathematical equations to calculate line of plotting. Momentum measures the velocity with which bitcoin price changes. This is calculated as the difference between the ruling bitcoin price candle and the average bitcoin price of a chosen number of bitcoin price bars ago.
Momentum tracks Bitcoin price change speed over set times. Quick rises mean strong upward force. Fast drops show big downward pull.
As the speed of the bitcoin price changes begins to slow down, the force will also begin to slow and go back to a middle point.

Momentum
BTCUSD Analysis and Generating Signals
This btcusd indicator is designed to produce technical buy and sell signals for cryptocurrency trading. The three most common signal generation methods include:
Zero Centerline Bitcoin Cross-overs BTCUSD Trade Signals:
- A buy cryptocurrency signal is generated when the Momentum crosses above zero
- A sell cryptocurrency signal gets generated/derived when the Momentum crosses below zero
Over-bought/Oversold Levels:
Momentum acts as an overbought/oversold indicator by pinpointing potential levels using previous momentum highs or lows. These values help determine when an asset has become overbought or oversold in the market.
- Readings above the overbought level mean bitcoin is overbought and a bitcoin trade price correction is pending
- While readings below the oversold level the bitcoin price is oversold & a bitcoin price rally is pending.
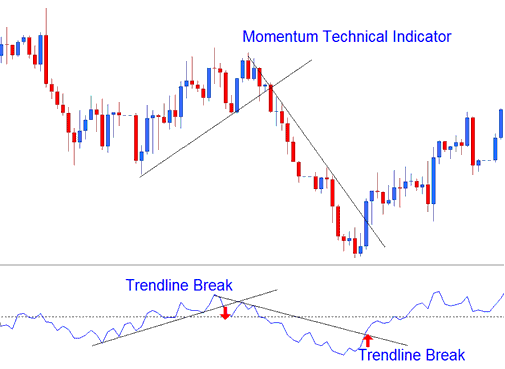
Bitcoin TrendLine Break Outs:
You can draw bitcoin trend lines on the Momentum indicator by connecting the highs and lows. Momentum usually shifts before bitcoin's price does, so it's a good leading indicator.
- Bullish reversal - Momentum readings breaking above a downward bitcoin trendline warns of a possible bullish reversal cryptocurrency signal while
- Bearish reversal - momentum readings breaking below an upward bitcoin trend line warns of a possible bearish reversal bitcoin signal.

Analysis in BTCUSD Trading
More Topics & Lessons:
- Oscillator Indicators – BTC USD Tools for Traders
- Applying the Alligator Indicator for BTC/USD Trading on MT4
- How Can You Set Download MetaTrader 4 Bitcoin Trading Robot in MT4 Software Platform?
- Ways to Trade RSI 50 Centerline Crossover with BTC USD
- MT4 Bitcoin Platform Tutorial Candles Chart Analysis BTC USD Trading Guide Tutorial
- Tutorial: How to Successfully Log In and Sign In to a Real Account on MetaTrader 4
- Methods for Analyzing and Interpreting Signals from Candlestick Patterns
- What Happens in BTC USD after a Trendline is Broken?
- Best Times to Trade Bitcoin
- A guide on signing up for an MT4 BTCUSD trading account made simple.
