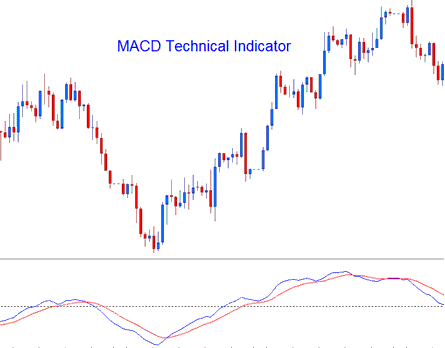
MACD
Created by Gerald Appel,
The Moving Average Convergence/Divergence is one of the simplest, reliable, & most oftenly used indicators.
It is a momentum oscillator and also a trend-following indicator.
Construction
The construction of this indicator calculates the difference between 2 moving averages & then plots that as "Fast" line: the second "Signal" line is then calculated from the resulting "Fast" line and then drawn on the same panel window panel as "Fast" line.
- "Fast" line - Blue Line
- "Signal" line - Red Line
The "standard" MACD values for "Fast" line is a 12-period exponential moving average and a 26-period exponential moving average and a 9-period exponential moving applied to the fast line, this plots the "Signal" line.
- FastLine = difference between 12 & 26 exponential moving averages
- Signal Line = moving average of this difference of 9-periods
BTCUSD Analysis & How to Generate Trading Signals
The MACD is commonly used as a trend-following indicator & works most effectively when analyzing trending market movements. Three common methods of using MACD to generate signals are:
BTCUSD Trading Crossovers Bitcoin Trading Signals:
FastLine/Signal Line Crossover:
- A buy cryptocurrency signal is generated when the Fast line crosses above the Signal line
- A sell cryptocurrency signal is generated when the Fast line crosses below the Signal line.
However, in a strong trending market this cryptocurrency signal gives a lot of whipsaws, the best cross over to use would thus be the Zero Line Crossover Signal that is less prone to whipsaws.
Zero Line Crossover Signals:
- When the Fast-line crosses above the zero center-line a buy bitcoin signal is generated.
- when the Fast-line crosses below zero center-line a sell bitcoin signal is generated.
Divergence Bitcoin Trading:
Looking for divergences between the MACD & bitcoin price can prove to be very effective in identifying potential reversal &/or bitcoin trend continuation points in bitcoin price movement. There two types of divergences:
- Classic Divergence Signals
- Hidden Divergence Signals
Overbought/Oversold Conditions:
MACD indicator is also used to spot potential overbought/oversold conditions in bitcoin price action movements.
These levels are generated if the shorter MACD Lines separate dramatically from the median, this is an indication that bitcoin price action is over-extending & it will soon return to more realistic levels.
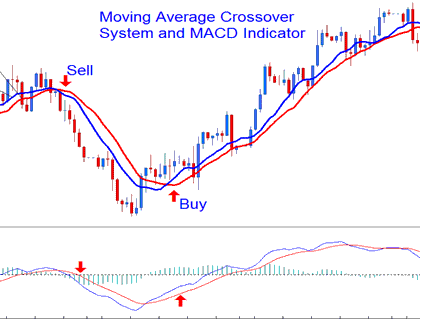
MACD & Moving Average BTCUSD Trading Crossover Bitcoin Trading System
This btcusd indicator can be combined with others to form a cryptocurrency system. A good combination with the Moving Average cross-over system. A signal is generated when both give a signal in same direction.
Technical Analysis in BTCUSD Trading