Linear Regression Signals for Bitcoin Trades
Another way to say regression line is a line that best fits the data. This btcusd indicator shows the general trend of the bitcoin price over a certain period of time. The bitcoin trend is found by using a method called "least square fit" to draw a Linear Regression Bitcoin Trend Line. This method helps to make the distance between the bitcoin price points and the line that best fits the data as small as possible.

In contrast to the linear Regression Trend Line indicator, this technical indicator plots the calculated endpoint values of multiple Linear Regression trend lines. Any specific point along the displayed Linear Regression line corresponds exactly to the terminal value of a corresponding Regression Trendline, yet the resulting Bitcoin trendline visually resembles that of a Moving Average.
However, in contrast to the Moving Average, this indicator exhibits less inherent lag because it constructs a curve that fits the data points rather than simply averaging them.
The Linear Regression is predicting what the bitcoin price will be tomorrow, based on today. If the actual bitcoin prices are consistently higher or lower than what was predicted, then traders can think they will soon go back to expected levels.
Simply put, this tool shows where Bitcoin prices "should" be based on statistics: any big price change away from the line is likely to not last very long.
BTCUSD Analysis and How to Generate Signals
This BTCUSD indicator lets you choose the price, adjust the number of periods, smooth out the price data, and pick your smoothing type before running the calculation.
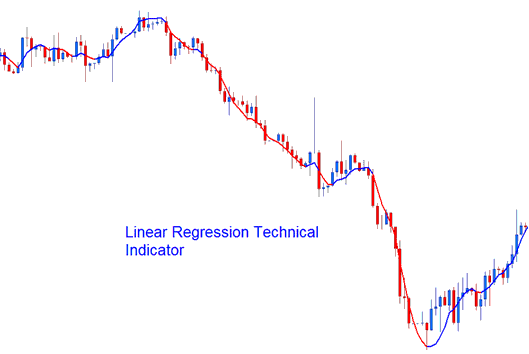
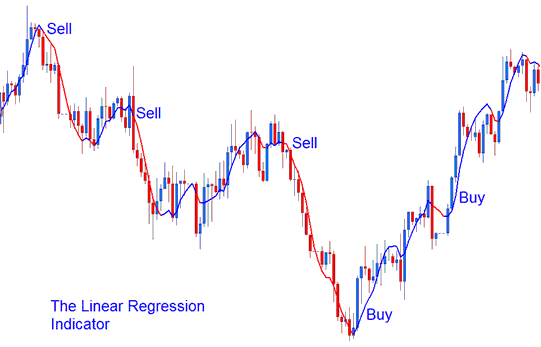
This BTCUSD technical indicator resembles a moving average but features a bi-color representation.
- Bullish Signal (Blue color) - A rising line (greater and higher than its previous value one previous price bar before) is displayed and illustrated in the up bitcoin trend blue color, while
- Bearish Signal (Red color) - a declining/falling line (lower and lesser than its previous value 1 previous bar before) is displayed in the down bitcoin trend red color.

Analysis in BTCUSD Trading
More Guides & Tutorials:
