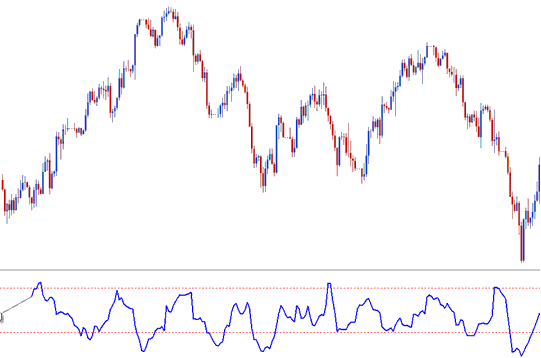
Choppiness Index Bitcoin Analysis & Choppiness Index Signals
Developed by E.W. Dreiss
The Choppiness Index was engineered as a straightforward yet functional technical tool to assist Bitcoin traders in discerning whether Bitcoin prices are currently exhibiting a trend or moving sideways (consolidating).
This Indicator is like ADX, which also checks how strong a bitcoin trend is and figures out if the btcusd market is trending or not moving much.

The Choppiness Index utilizes a range from 0 to 100. It also commonly uses high and low limits at 61.8 and 38.2 accordingly.
This btcusd indicator is constructed by initially calculating the True Range for every timeframe period and then aggregating the values across 'n' number of periods.
Secondly, it computes the maximum attained value and the minimum value across 'n' defined periods and determines the differential between them.
Thirdly, it aggregates the totality of the true range figures and subsequently computes the base-10 logarithm of that resultant sum.
In the end, it takes that figure and divides by the base-10 log of n price periods. Then multiplies by 100.
BTCUSD Analysis and How to Generate Signals
The Choppiness Index is classified as a non-directional indicator: it offers no guidance regarding the prevailing directional bias of the Bitcoin market.
The main idea is that if the btcusd market is strongly trending over a certain number of periods, the Choppiness Index will be close to zero. Also, if the btcusd market is staying about the same, moving sideways in a range, over a certain number of periods, the Choppiness Index will be close to 100.
Indicator results above 61.8 show that the btcusd market doesn't have a clear direction (moving back and forth).
High values show up during or after strong consolidation. They can signal a breakout soon after long pauses.
Choppiness Index values below 38.2 suggest that the btcusd market is in a trending phase.
You usually see lower values during or right after a strong trend. These dips can mean the market's about to settle down and get choppy after a big bitcoin move.
Find Additional Classes and Courses:
- Top Bulls Power BTC USD Indicator Combo for Trading in MetaTrader 4
- Candlestick Charts Free BTC USD Strategy
- Introduction to BTC USD Training Course Tutorial Lesson
- Trade BTC USD Buy & Sell Instrument in BTC USD Trade
- How Do You Set Stop Loss Trade Orders in MT4 Platform
- How Do You Set BTC USD Orders in MT5 BTCUSD Charts?
- How Do I Interpret Fibonacci Pullback Levels BTC USD Trade Analysis?
- How Do I Draw BTC USD Fibonacci Extension on BTC USD Charts?
- How to Use the Alligator BTCUSD Indicator on the MT4 Program
- How Do I Interpret Fibonacci Pullback Levels on BTC USD Charts?
