Multiple Time-Frame Analysis
Multiple time frames analysis equals using 2 chart time-frames to trade Bitcoin Trading - a shorter one used for trading & a longer one to check Bitcoin trend.
Since it's always good to follow the trend, in Multiple Timeframe Analysis, longer timeframe gives us the direction of the long term trend.
If the long term market direction supports the direction of the smaller chart timeframe then the probability of being profitable is greatly increased. This is because even if you make a mistake the long term bitcoin trend will eventually save you. Also if you trade with the direction of btcusd trading market, then mostly you will be on winning side, this is what this analysis is all about.
Remember there is a popular saying by many Bitcoin Trading & stock market traders that says: 'The bitcoin trend is your friend' - never go against the btcusd trading market.
There are four different types of Bitcoin traders - all these use different charts to trade as explained below.
Examples of how each type of BTCUSD trader uses multiple Bitcoin BTCUSD Trading time frames analysis strategies:
Scalpers
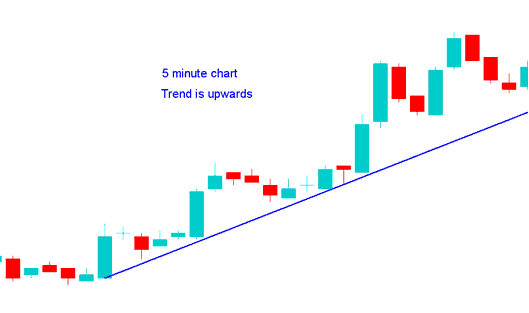
This group holds on to their trades for only a few minutes. Scalper never holds on to a trade for more than ten minutes. With the objective of making a small amount of pips as profit, 5 - 20 pips.
A Scalper using 1 min chart wants to go long, checks 5 min trading chart, that look like the one below, since 5 min illustrate bitcoin trend is going up, then decides from this analysis it's ok to buy.
Best Chart Timeframe to Trade Bitcoin
Day Traders
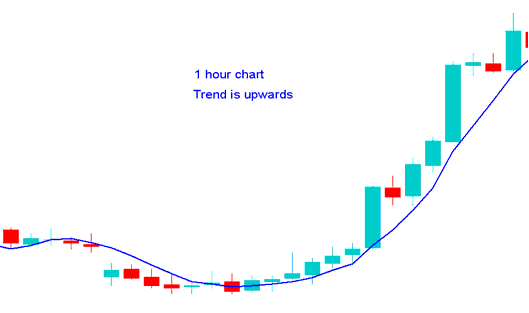
This group holds on to their trades for a few hours but not more than a day. With the objective of making quite a number of pips: 30 - 100 pips.
Day trader trading 15 min chart wants to go long, checks the 1 H chart, that look like the one below, since 1 hour shows market bitcoin trend is going up, then decides from this analysis it's ok to buy
Best Chart Timeframe to Trade Bitcoin
Swing Traders
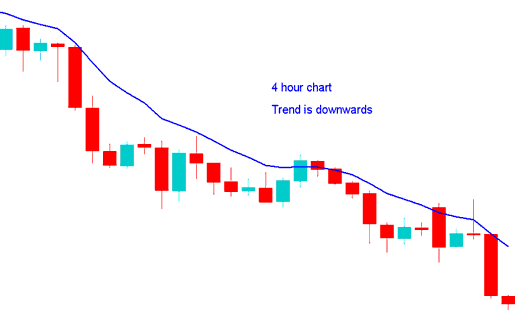
This group holds on to their trades for a few days to a week. With the objective of making a large number of pips: 100 - 400 pips.
Swing trader using the 1 H trading chart wants to go short, checks the 4 H chart, that look like the cryptocurrency trading example illustrated below, since 4 hour shows the bitcoin trend is going down, then decides from this analysis it's ok to sell.
Best Chart Timeframe to Trade Bitcoin
Position BTCUSD Traders
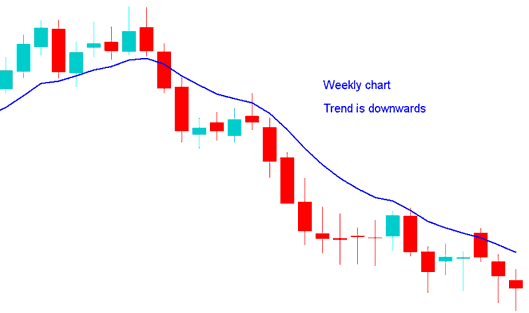
These are the investors that hold on to their trades for weeks or months. With the objective of making a large number of pips: 300 - 1000 pips.
Position trader using the daily chart wants to short, checks weekly chart, weekly looks like the one below, since weekly shows the bitcoin trend is going down, then decides from this analysis it's ok to sell.
Best Chart Timeframe to Trade Bitcoin
How to Define A Bitcoin Trading Trend
Using a bitcoin system has three indicators - Moving Average Crossover System, RSI & MACD & uses simple rules to define the trend. Rules are:
Upward trend
Both MAs Moving Up
RSI above 50
MACD Above Centerline
Downward BTCUSD Trading Trend
Both MAs Moving Down
RSI below 50
MACD Below Centerline
For More explanation about this system read: How to Generate Bitcoin Trading Signals with a Bitcoin Trading System.


