Which Stocks Candle Pattern is Bullish?
The list below explains all the bullish candles patterns and their technical analysis on how to interpret these bullish stocks signals & how to trade stocks charts using these bullish candles patterns.
Hammer Stocks Candles
Hammer candles - hammer is bullish reversal stocks candle pattern
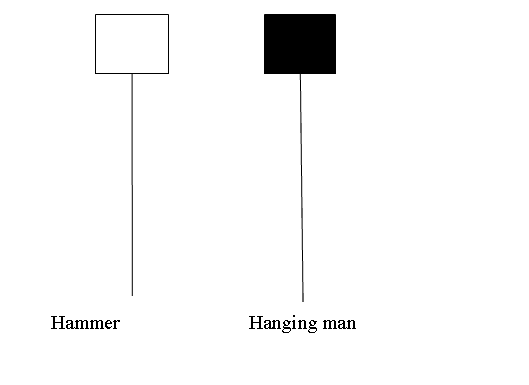
Hammer Candlesticks - Bullish Stocks Candlesticks Patterns Tutorial
Hammer Candlestick Stocks Candlesticks
Hammer stocks candle pattern is a potentially bullish stocks candlestick pattern which forms during a stocks downwards trend. It is named so because the stocks market is hammering out a market bottoms.
Inverted Hammer Candle Stock Candles
This is a bullish reversal candlestick pattern. It forms at the bottoms of a Stocks trend.
Inverted hammer candle pattern forms at the bottom of a down stocks trend & indicates the possibility of reversal of the downward Stocks trend.
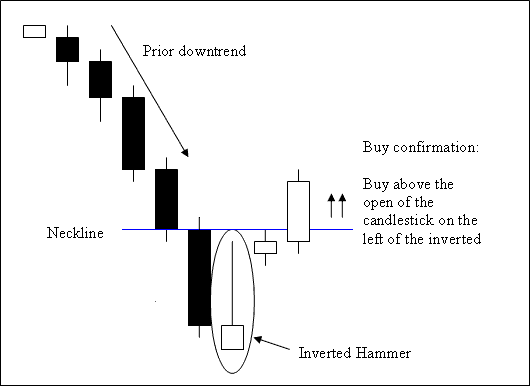
Inverted Hammer Candle Pattern - Bullish Stocks Candlesticks Patterns Tutorial
Morning Star Candlestick Stocks Candlesticks
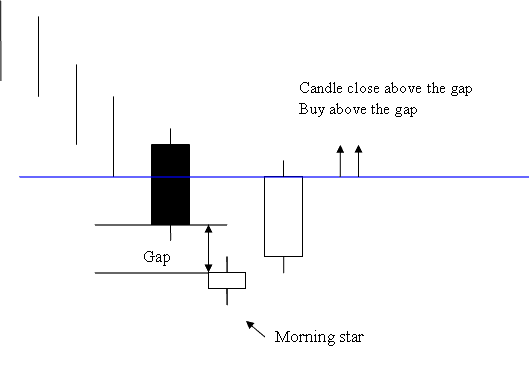
Morning Star Candle Pattern - Bullish Stocks Candlesticks Patterns Tutorial
Piercing Line Candle Stock Candles
Piercing line candle stick pattern is a long black body followed by a long white body candle-stick.
The white body pierces the mid point of the prior black body.
This Piercing Line stocks candlestick pattern is a bullish reversal candlestick pattern that forms at the bottom of a market downward stock trend. It shows that the stocks market opens lower and closes above the midpoint of the black body.
This Piercing Line stocks candlestick pattern shows that the momentum of the down stocks trend is reducing and stocks market stocks trend is likely to reverse and move in an upward direction.
This Piercing Line stocks candle pattern is shown known as a piercing line signifying the stocks market is piercing the bottom showing a market floor for the stock price downwards trend.
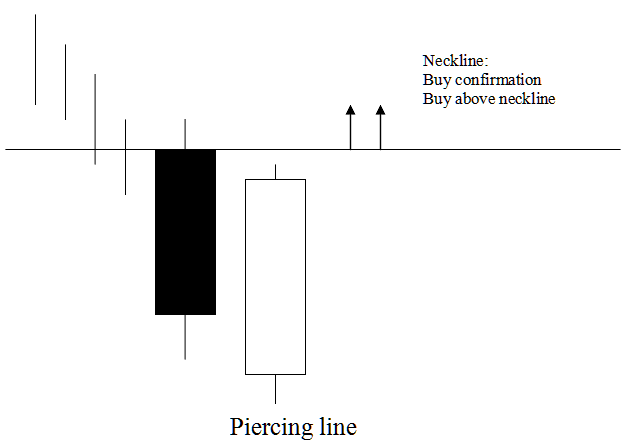
Piercing Line Candlesticks Pattern- Bullish Stocks Candlesticks Patterns Tutorial
Bullish Engulfing Candlesticks Patterns
Engulfing is a reversal candlestick pattern which can be bearish or bullish depending upon whether it appears at the end of a stocks market down stocks trend or at the end of a stocks market upward trend.
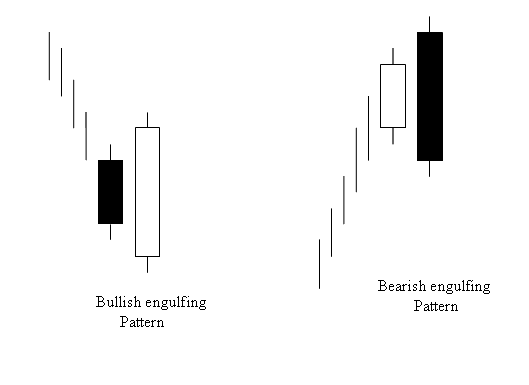
Bullish & Bearish Engulfing Candle Pattern - Bullish Stocks Candlesticks Patterns Tutorial
Which Stocks Candle Pattern is Bullish? - The List of Bullish Stock Candle Patterns


