Which Stocks Candle Pattern is Bearish?
The list below explains all the bearish candles patterns & their technical analysis on how to interpret these bearish stocks signals and how to trade stocks charts using these bearish candles patterns.
Hanging Man Candle Stocks Candlesticks
This hanging man candlesticks pattern is a potentially bearish stocks reversal signal that occurs during a stocks upwards trend. It is named so because it looks like a man hanging on a noose up high.
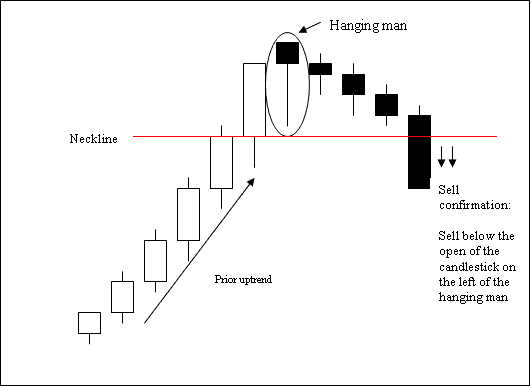
Hanging Man Candle Pattern - Bearish Stocks Candles Patterns Guide
Shooting Star Candlestick Stock Candles
Shooting Star candlesticks pattern is a bearish reversal candle pattern. It occurs at the tops of a stock trend.
Shooting Star candle-sticks pattern occurs at the top of an up stocks trend in the Stocks market where the open stocks price is the same as the low & stocks price then rallied up but was pushed back downwards to close near the open.
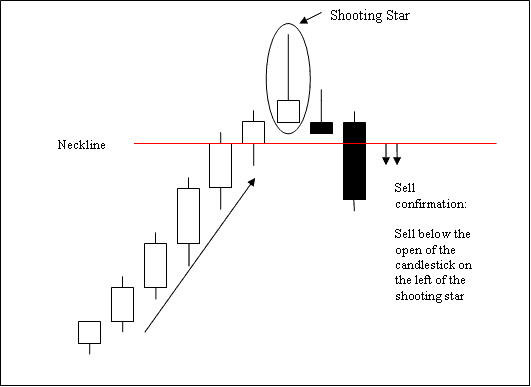
Shooting Star Candle Pattern - Bearish Stocks Candles Patterns Guide
Dark Cloud Cover Candlestick Stocks Candles
Opposite of Dark Cloud cover candlestick pattern is the Piercing Line candlestick pattern stocks candle.
Dark Cloud cover candle pattern is a long white body followed by a long black body.
Black body pierces the midpoint of the prior white body.
This is a bearish reversal stocks pattern which forms at the top of an upwards stock trend.
Dark Cloud Cover Candle Pattern that the stocks market opens higher and closes below the midpoint of the white body.
Dark Cloud Cover Candle Pattern shows that the momentum of the up stocks trend is reducing & stocks market stocks trend is likely to reverse and move in a downward stocks direction.
Dark Cloud Cover Stocks candlestick pattern is shown known as a cloud cover signifying the cloud as a ceiling for the stock price upward trend.
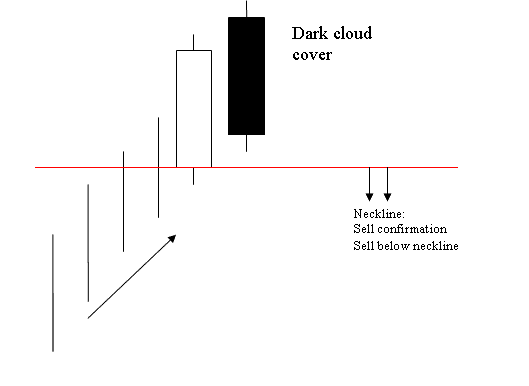
Dark Cloud Cover Candlestick Pattern - Bearish Stocks Candles Patterns Guide
Evening Star Candle Stocks Candlesticks
Opposite of Evening Star Stocks candlestick pattern is the morning star candlestick pattern stock candlesticks pattern
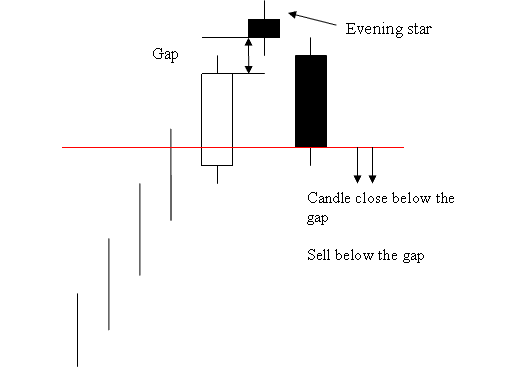
Evening Star Stocks candlestick pattern - Bearish Stocks Candles Patterns Guide
Bearish Engulfing Candles Pattern
Engulfing is a reversal candlestick pattern which can be bearish or bullish depending upon whether it appears at the end of a stocks market down stocks trend or at the end of a stocks market upward trend.
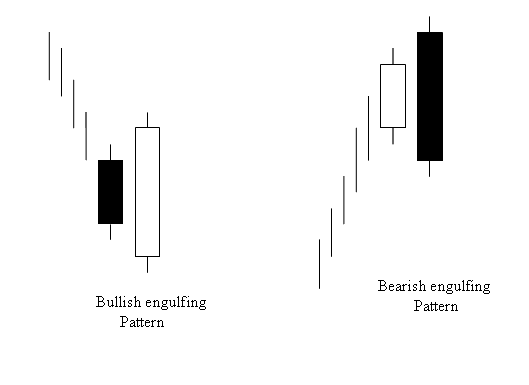
Bullish & Bearish Engulfing Candles Patterns - Bearish Stocks Candles Patterns Guide
Which Stocks Candle Pattern is Bearish? - The List of Bearish Stock Candle Patterns


