What's the W Stock Chart Pattern in Stocks?
The W pattern in stocks is a double bottoms chart pattern look like a W Shape, the best reversal stocks signal is where the second bottoms is higher than the first one as displayed below, this means that the reversal can be confirmed by drawing an upward stocks trend line as shown below. If a trader opens a buy trading signal the stop loss will be placed just below this upward trend line.
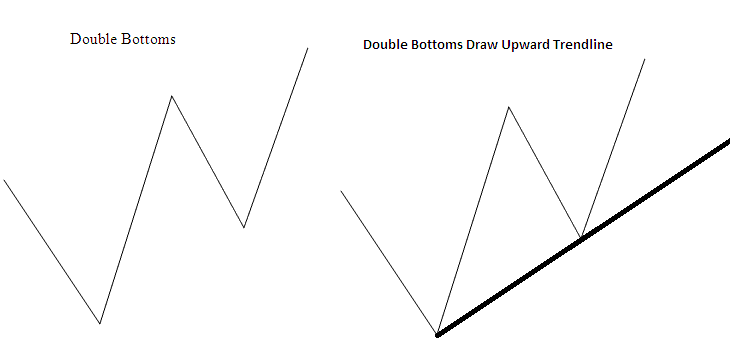
W Shaped Double Bottoms Pattern - What is the W Stock Chart Pattern in Stocks?


