What is a Line Chart in Stocks?
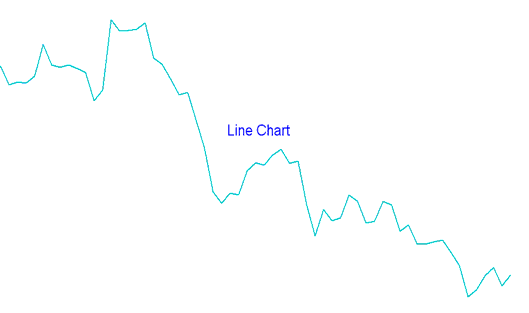
A line chart in Stocks draws the closing stocks price on a stocks chart and connects this closing stocks price to the closing stocks price of the next trading period hence forming a continuous line chart that plots the movement of a stocks instrument's stocks price movement.
Types of Stocks charts
There are Three types of charts used in Stocks: Line charts, bar charts & candles charts.
Line Chart - plots a continuous line connecting closing stocks prices of a stocks.
What is a Line Chart in Stocks?


