What is a Bar Chart in Stocks?
Types of Stock Charts
There are Three types of charts used in Stocks: Line charts, bar charts and candles charts.
Bar Chartsare charts representation of the stocks price on a stock chart shown as sequence of OHCL bars. O H C L represents OPEN HIGH LOW & CLOSE. The Opening stocks price is displayed as a horizontal dash on the left and closing stocks price as a horizontal dash on the right.
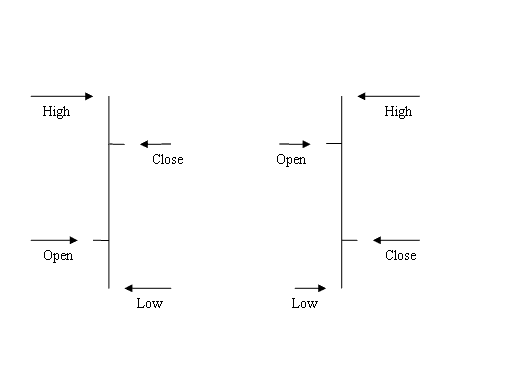
Bar Charts - What is a Bar Chart in Stocks?


