Types of Hammer Candle Patterns - Hammer Bullish Stock Candlestick Patterns
Hammer Bullish Stock Candlestick Patterns
Reversal candle patterns occur after an extended prior trend. Therefore, for a candlestick pattern to qualify as a reversal candle pattern there must be a prior trend.
These reversal candle patterns are:
- Hammer Candlesticks Pattern and Hanging Man Candlestick Pattern
- Inverted Hammer Candlesticks Pattern and Shooting Star Candlestick Pattern
- Piercing Line Stocks Candle Pattern and Dark Cloud Cover Candlestick Pattern
- Morning Star Candlesticks and Evening Star Candlesticks
- Engulfing Candles Patterns
Hammer Candles Pattern & Hanging Man Candlestick Pattern
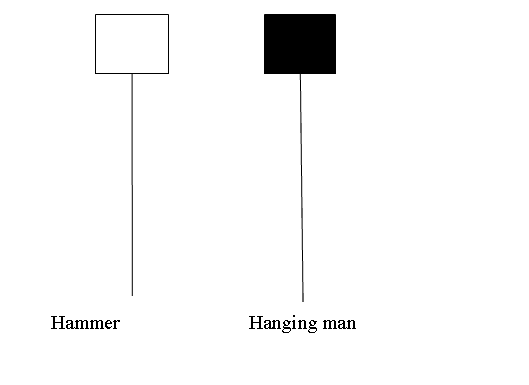
Hammer Candlesticks Pattern and Hanging Man Candle Pattern candlesticks look alike but hammer is bullish reversal candle pattern & hanging man is a bearish reversal candle pattern.
Hammer Candles Pattern & Hanging Man Candlestick Pattern
Hammer Candlesticks Patterns
Hammer is a potentially bullish pattern which occurs during a stocks downwards trend. It is named so because the stocks market is hammering out a market bottoms.
A hammer has:
- A small body
- The body is at the top
- The lower shadow is two or three times length of the real body.
- Has no upper shadow or very small upper shadow if present.
- The color of the body isn't important
Hammer Candles
Technical Analysis of Hammer Candlesticks Patterns
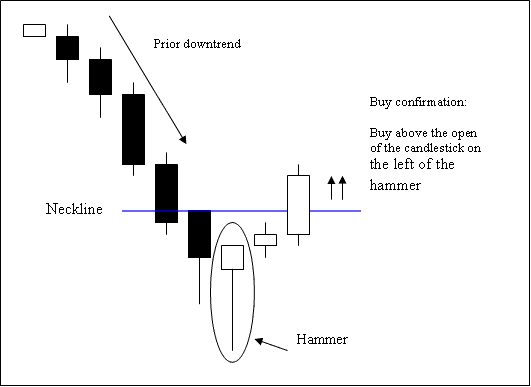
The buy signal is confirmed when a candlestick closes above the opening stocks price of the candle to the left side of this hammer candlestick pattern.
Stop orders should be placed a few pips just below the low of the hammer candle-stick.
Inverted Hammer Bullish Stock Candlestick Patterns
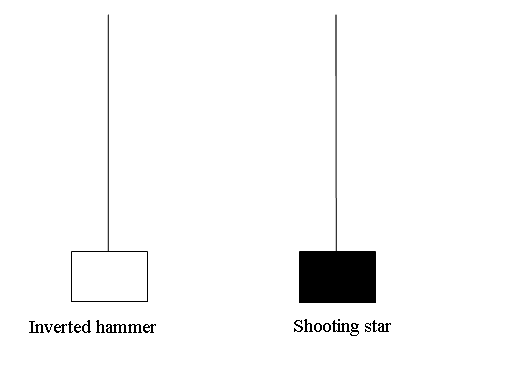
Inverted Hammer Candles Pattern and Shooting Star Candlestick Pattern candlesticks look alike. These have a long upper shadow and a short body at the bottom. Their color does not matter. What matters is the point where they appear whether at the top of a market stocks trend (star) or the bottom of a market stocks trend (hammer).
The difference is that inverted hammer is a bullish reversal candle pattern while shooting star is a bearish reversal candle pattern.
Upward Stocks Trend Reversal - Shooting Star Candles
Downward Stocks Trend Reversal - Inverted Hammer Candles
Inverted Hammer Candles Pattern and Shooting Star Candlestick Pattern Stock Chart Patterns
Inverted Hammer Stocks Candlestick
This is a bullish reversal candle pattern. It forms at the bottoms of a Stocks trend.
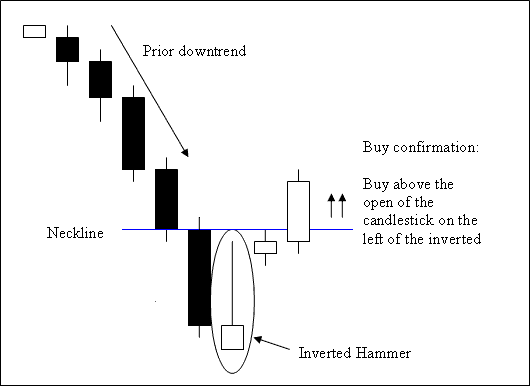
Inverted hammer forms at the bottom of a down stocks trend & indicates the possibility of reversal of the downward Stocks trend.
Inverted Hammer Stocks Trading Candlestick
Technical Analysis of Inverted Hammer Stock Trading Candle
A buy is completed when a candle stick closes above the neckline, this is opening of the candle stick on the left side of this pattern. The neck line level in this acts as a resistance zone.
Stop orders for the buy stock trades should be placed a few pips below the lowest stocks price on the recent low.
An inverted hammer is named so because it signifies that the stocks market is hammering out a bottoms.


