Trading Stocks Predict Stocks Candlesticks Patterns Trend Reversal
Trading Stocks Predict Stocks Candlesticks Patterns Trend Reversal Stocks Signals
Stocks trend reversal setups using Stock Candles Patterns are used to predict stocks trend reversals using Stock Candlesticks Patterns.
Stocks Candlesticks Patterns trend reversal trading signals are used to signal when the current trend direction might reverse and begin moving in the opposite trend direction.
There are various Stocks Candlesticks Patterns trend reversal setups that are used by traders to try & determine when the price trend might reverse.
Among the various Stocks Candlesticks Patterns - stocks reversal trading set ups that are used to spot stocks trend reversals in stocks are:
Stocks Candlestick Patterns
Stocks Trading reversal candles patterns are used to generate stocks signals that identify when a stocks trend is likely to reverse. With stocks candlesticks stocks traders will try to predict stocks trend reversals based on the various stocks trend reversal candles patterns.
Stocks Trading candlesticks reversal stocks patterns are:
- Hammer Stocks Trading Reversal Candle Pattern
- Hanging Man Stocks Trading Reversal Candle Pattern
- Inverted Hammer Stocks Trading Reversal Candle Pattern
- Shooting Star Stocks Trading Reversal Candle Pattern
- Piercing Line Stocks Trading Reversal Candle Pattern
- Dark Cloud Cover Stocks Trading Reversal Candle Pattern
Hammer Candle Pattern & Hanging Man Candle Pattern Stocks Reversal Candle Pattern
Hammer Candlestick Pattern and Hanging Man Candlestick Pattern candles look alike but hammer is bullish reversal stocks candles pattern and hanging man is a bearish reversal stocks candlesticks pattern.
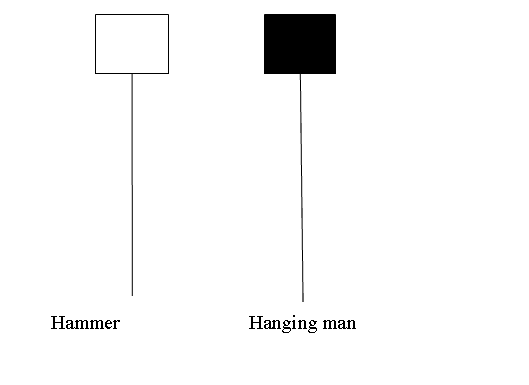
Hammer Candlestick Pattern and Hanging Man Candlestick Pattern - Stocks Reversal Candle Pattern
Hammer Candle Stocks Reversal Candle Pattern
Hammer stocks candlesticks pattern is a potentially bullish stocks trading reversal candlestick pattern which forms during a downwards stock trend. It is named so because the stocks price is hammering out a market bottom.
Hanging Man Candle Stocks Reversal Candle Pattern
This hanging man candlesticks pattern is a potentially bearish stocks reversal signal which occurs during a upward stock trend. It is named so because it resembles a man hanging on a noose up high.
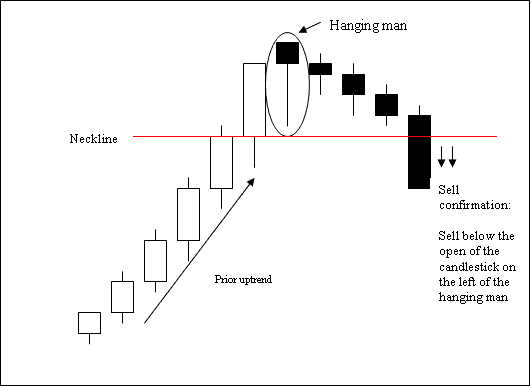
Hanging Man Candle Pattern - Stocks Reversal Candle Pattern
Inverted Hammer Candle Stocks Reversal Candle Pattern
This is a bullish reversal candlesticks pattern. It forms at the bottoms of a Stocks trend.
Inverted hammer candles pattern occurs at the bottom of a downward stocks trend & indicates the possibility of reversal of the downward stock trend.
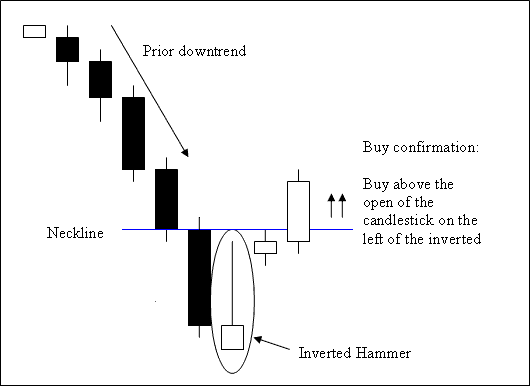
Inverted Hammer Candle Pattern - Stocks Trading Reversal Candle-Stick Pattern - Trading Stocks Predict Stocks Candles Patterns Trend Reversal
Shooting Star Candlestick Stocks Reversal Candle Pattern
Shooting Star is a bearish reversal candles pattern. It forms at the top of a stocks price trend.
Shooting Star stocks candles pattern occur at the top of an upward stocks trend in the stocks price where the open stocks price is the same as the low & stocks price then rallied up but was pushed back downward to close near the open.
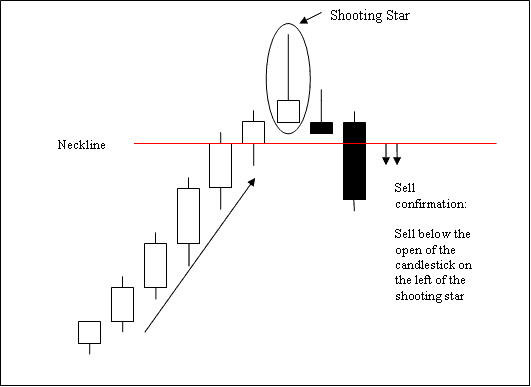
Shooting Star Candlestick - Stocks Reversal Candle Pattern
Piercing Line Candle Stocks Reversal Candle Pattern
Piercing line candle stick pattern is a long black body followed by a long white body candle-stick.
The white body pierces the mid point of the prior black body.
This Piercing Line stocks candle-sticks pattern is a bullish reversal candles pattern that forms at the bottom of a stock price downwards trend. It shows that the stocks price opens lower and closes above the midpoint of the black body.
This Piercing Line stocks candlesticks pattern shows that the momentum of the downward stocks trend is reducing and stocks price trend is likely to reverse and move in an upward direction.
This Piercing Line stocks candles pattern is shown known as a piercing line signifying the stocks price is piercing the bottom showing a market floor for the stocks price downwards trend.
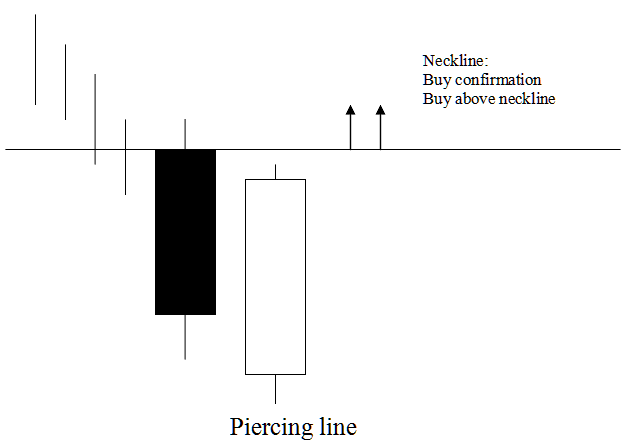
Piercing Line Candle Pattern - Stocks Reversal Candle Pattern
Dark Cloud Cover Candlestick Stocks Reversal Candle Pattern
Opposite of piercing candle-stick stocks candle.
This candlestick is a long white body followed by a long black body.
The black body pierces the midpoint of the prior white body.
This is a bearish reversal stocks pattern which forms at the top of an upwards stock trend.
Dark Cloud cover stocks candlesticks pattern shows that stocks price opens higher and closes below the midpoint of the white body.
Dark Cloud cover stocks candlesticks pattern shows that the momentum of the upward trend is reducing & the stocks price trend is likely to reverse and move in a downward stocks trading direction.
Dark Cloud cover stocks candles pattern is shown known as a cloud cover signifying the cloud as a ceiling for stocks price upwards trend.
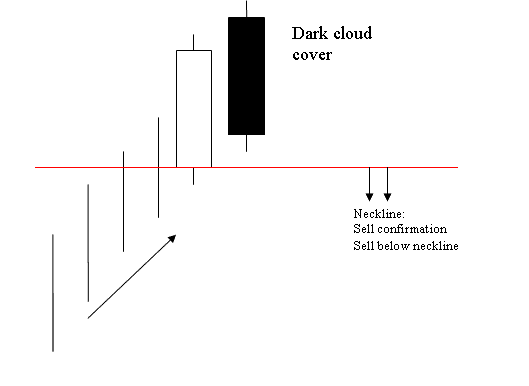
Dark Cloud Cover Candlestick Pattern - Stocks Reversal Candle Pattern
Trading Stocks Predict Stocks Candlesticks Patterns Trend Reversal - Trading Stocks Predict Stocks Candlesticks Patterns Stock Trend Reversals - Trading Stocks Predict Stocks Candlesticks Patterns Trend Reversal Stocks Signals - How to Detect Stocks Candlesticks Patterns Trend Reversal Setups


