Stocks Trading Interpret Inverted Hammer Candlesticks Pattern Technical Analysis
Inverted Hammer candle sticks pattern is a bullish reversal candle pattern. It forms at the bottoms of a Stocks trend.
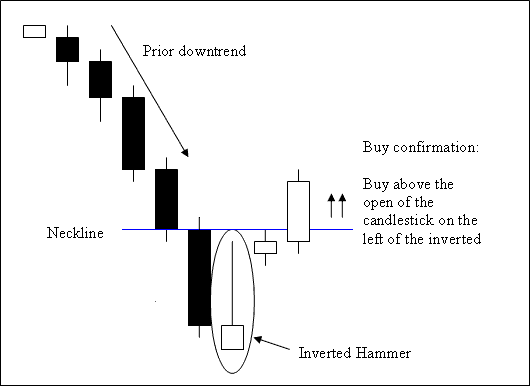
Inverted Hammer stocks candles pattern occurs at the bottom of a downward trend & indicates the possibility of reversal of the downward stock trend.
Stocks Trading Interpret Inverted Hammer Candlesticks Pattern Technical Analysis
Technical Analysis of Inverted Hammer Candle Pattern
A bullish reversal buy trading signal is confirmed when a candlestick closes above the neckline, this is the opening of the candlestick on the left side of this inverted hammer candles pattern. The neck line level in this acts as a resistance zone.
Stop orders for the buy stock trades should be placed a few pips below the lowest stocks price on the recent low once a trader opens a trade based on this candles pattern setup. An inverted hammer candles pattern is named so because it signifies that the stocks market is hammering out a bottoms.


