Divergence Stocks Strategy
Hidden divergence trading strategy is used as a possible sign for a stocks market stocks trend continuation after the price has retraced. It is a trading signal that the original stocks trend is resuming. This is the best divergence trading setup to trade because it is in the same direction as that of the continuing market trend.
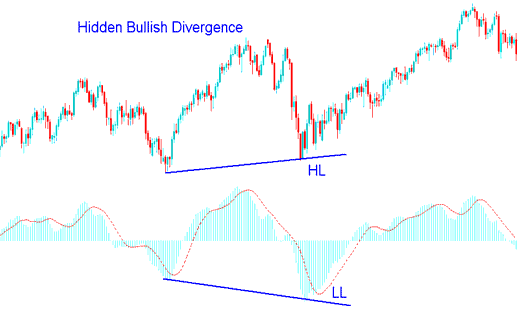
Stock Hidden Bullish Divergence
This divergence trading setup happens when price is making a higher low ( HL ), but the oscillator (indicator) is showing a lower low (LL). To remember them easily think of them as W-shapes on Chart patterns. It occurs when there is a retracement in an upward stock trend.
The examples illustrated & explained below shows an image of this divergence setup, from the screenshot the stocks price made a higher low (HL) but the indicator made a lower low (LL), this shows that there was a divergence signal between the stocks price and indicator. This signal shows that soon the stocks market up stocks trend is going to resume. In other words it shows this was just a retracement in an upwards stocks trend.
Divergence trading strategy
This confirms that a retracement move is complete & indicates underlying strength of an upwards stock trend.
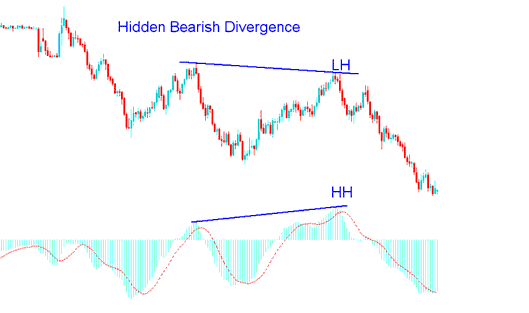
Stocks Hidden Bearish Divergence
This setup happens when price is making a lower high ( LH ), but the oscillator is showing a higher high (HH). To remember them easily think of them as M-shapes on Chart patterns. It occurs when there is a retracement in a downwards trend.
The example illustrated & explained below shows an image of this stocks setup, from the screenshot the stocks price made lower high (LH) but the indicator made a higher high (HH), this shows that there was a divergence between the stocks price & the indicator. This shows that soon the stocks market down stocks trend is going to resume. In other words it shows this was just a retracement in a downward trend.
Divergence trading strategy
This confirms that a retracement move is complete and indicates underlying strength of a downwards stock trend.
Other popular technical indicators used are CCI technical indicator (CCI), Stochastic Oscillator, RSI and MACD. MACD & RSI are the best technical indicators.
NB: Hidden divergence is the best type to trade because it gives a signal that's in the same direction with the current market trend, thus it has a high reward to risk ratio. It provides for best possible entry.
However, a trader should combine this stocks setup with another indicator like the stochastic oscillator or moving average and buy when the price is oversold, and sell when the price is overbought.
Combining Hidden Stock Divergence with Moving Average Stocks Trading Crossover Strategy
A good indicator to combine these stocks setups is the moving average indicator using the moving average cross-over method. This will create a good trading strategy.
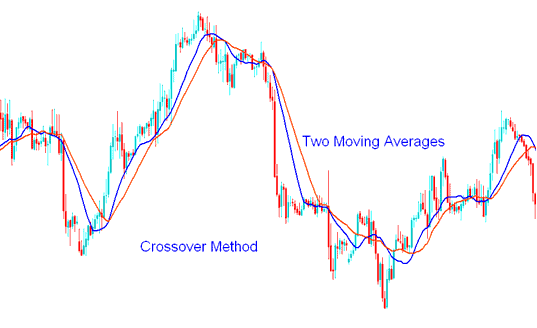
Moving Average Crossover Method - Divergence trading strategy
In this divergence stocks strategy, once the trading signal is given, a trader will then wait for the moving average cross over method to give a buy/sell trading signal in same direction, if there's a bullish divergence setup between the stocks price and indicator, wait for the moving average crossover system to give an upwards cross over signal, while for a bearish divergence set-up wait for the moving average crossover system to give a downward bearish crossover signal.
By combining this Divergence strategy with other indicators this way a trader will avoid whipsaws when it comes to trading with this stocks trade signal.
Combining with Stock Fibonacci Retracement Levels
For this example we shall use an upward market trend. The stocks instrument - We shall use the MACD indicator.
Because the hidden divergence is just a retracement in an upward stocks trend we can combine this stocks trading signal with most popular retracement tool that is the Fibonacci retracement levels. The example illustrated and explained below shows that when this stocks set-up appeared on the chart, the stocks price had just hit the 38.2% level. When stocks price tested this level, this would have been a good level to place a buy order.
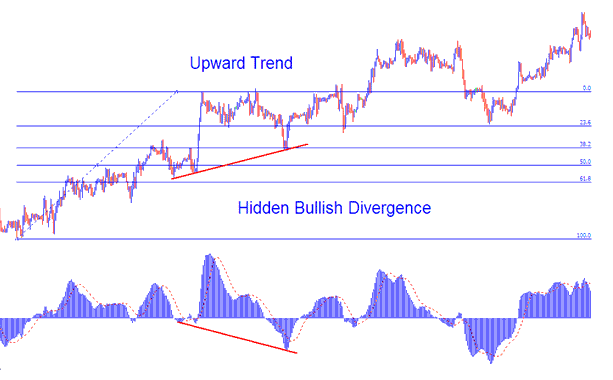
Divergence trading strategy set up
Combining with Stock Fibonacci Expansion Levels
In the stocks example above once the buy stocks trade was placed, a trader would then need to calculate where to set take profit for this trade. To do this one would need to use the Stocks Fib Expansion Levels.
The Fib expansion was drawn as shown and illustrated on the trading chart as shown below.
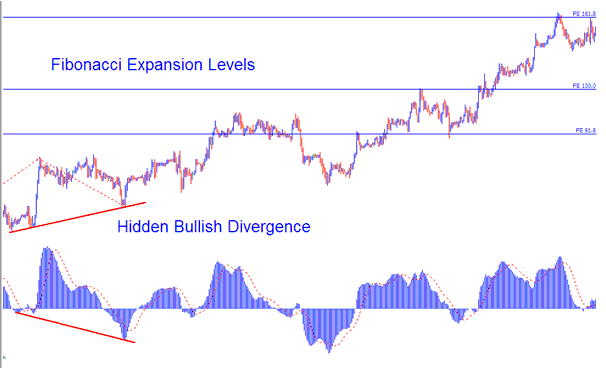
Divergence trading strategy set up
For this example there were 3 take profit areas:
Stocks Fibonacci Expansion Level 61.8% - 131 pips profit
Fibonacci Expansion Level 100.0% - 212 pips profit
Fibonacci Expansion Level 161.8% - 337 pips profit
From this divergence trading strategy combined with Fibonacci would have provided a good trading strategy with a good amount of profit set using these take profit levels.


