CCI Divergence Technical Indicator
CCI technical indicator is one of the commonly used divergence trading indicator. This stocks indicator is an oscillator similar to the RSI & it can be used to trade divergence setups just the same way as the RSI indicator.
CCI Stocks Technical Analysis & CCI Stock Signals
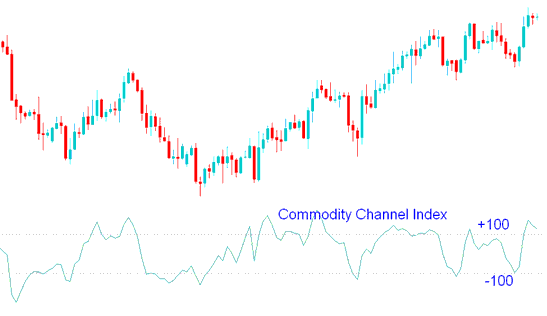
Commodity Channel Index measures the variation of a commodity stocks price from its statistical mean/statistical average.
CCI technical indicator is an oscillator which oscillates between high levels and low levels
When the CCI is high it shows that stocks price is unusually high compared to the its average.
When the CCI is low it shows that stocks price is unusually low when compared to the its average.
CCI Divergence Technical Indicator
CCI Divergence Technical Indicator
CCI Bullish Stocks Trading Divergence Setups
Classic CCI Bullish Stock Trading Divergence
CCI classic bullish divergence occurs when price is making lower lows (LL), but the CCI technical technical indicator is making higher lows ( HL ).
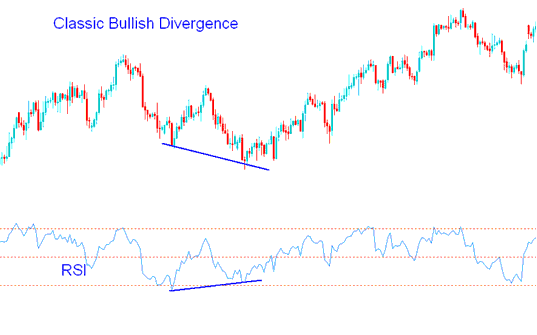
Stocks Classic Bullish Divergence - CCI Divergence Technical Indicator
CCI classic bullish divergence warns of a possible change in the stocks trend from down to up. This is because even though the stocks price went lower the volume of sellers that pushed the stocks trading price lower was less as illustrated and shown by the CCI technical indicator. This is an technical indicator of the underlying weakness of the downward trend.
Hidden CCI Bullish Stocks Trading Divergence
Forms when price is making a higher low (HL), but the CCI technical technical indicator is showing a lower low ( LL ).
CCI hidden bullish divergence occurs when there is a retracement in an upward stock trend.
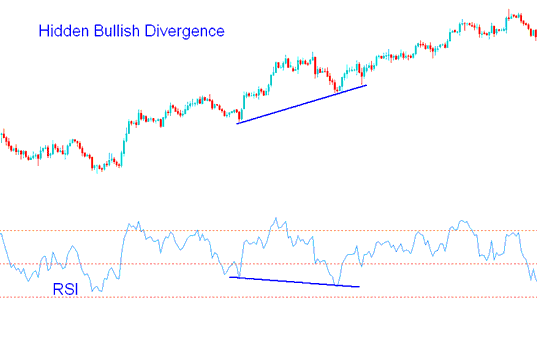
Stocks Hidden Bullish Divergence
This setup confirms that a retracement move is complete. This CCI divergence setup indicates underlying strength of an upward stock trend.
Bearish Stock Trading Divergence Setup
Hidden CCI Bearish Stock Trading Divergence
Forms when price is making a lower high (LH), but the oscillator technical indicator is showing a higher high ( HH ).
Hidden bearish divergence occurs when there is a retracement in a downward trend.
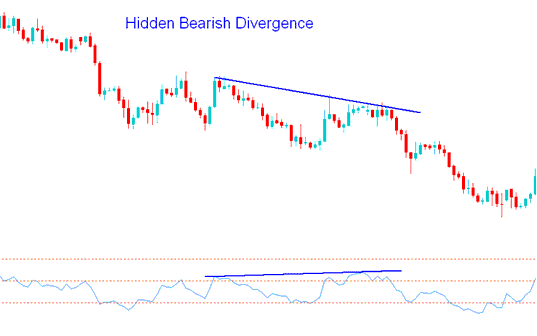
Stocks Hidden Bearish Divergence - CCI Divergence Technical Indicator
This setup confirms that a retracement move is complete. This divergence indicates underlying strength of a downwards stock trend.
CCI Classic bearish Stocks Trading Divergence
CCI classic bearish divergence occurs when price is making a higher high (HH), but the CCI technical technical indicator is making a lower high ( LH ).
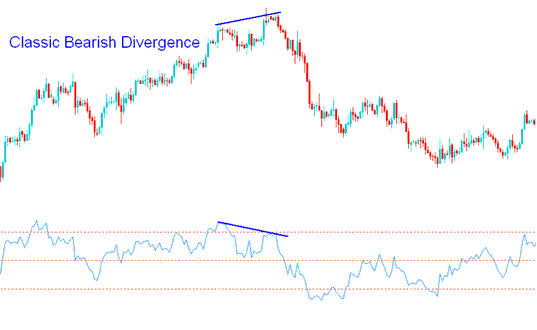
Stocks Classic Bearish Divergence - CCI Divergence Technical Indicator
CCI Classic bearish divergence warns of a possible change in the stocks trend from up to down. This is because even though the stocks price went higher the volume of buyers that pushed the stocks trading price higher was less as illustrated and shown by the CCI technical indicator. This is an technical indicator of the underlying weakness of the upward trend.


